
.jpg) 1 hour ago
1
1 hour ago
1
Article content
VANCOUVER, British Columbia, Aug. 06, 2025 (GLOBE NEWSWIRE) — West Red Lake Gold Mines Ltd.
(“West Red Lake Gold” or “WRLG” or the “Company”) (TSXV: WRLG)
(OTCQB: WRLGF) is pleased to provide an update on ramp-up activities at the Madsen Mine in Red Lake, Ontario.
![]()
THIS CONTENT IS RESERVED FOR SUBSCRIBERS ONLY
Subscribe now to read the latest news in your city and across Canada.
- Exclusive articles from Barbara Shecter, Joe O'Connor, Gabriel Friedman, and others.
- Daily content from Financial Times, the world's leading global business publication.
- Unlimited online access to read articles from Financial Post, National Post and 15 news sites across Canada with one account.
- National Post ePaper, an electronic replica of the print edition to view on any device, share and comment on.
- Daily puzzles, including the New York Times Crossword.
SUBSCRIBE TO UNLOCK MORE ARTICLES
Subscribe now to read the latest news in your city and across Canada.
- Exclusive articles from Barbara Shecter, Joe O'Connor, Gabriel Friedman and others.
- Daily content from Financial Times, the world's leading global business publication.
- Unlimited online access to read articles from Financial Post, National Post and 15 news sites across Canada with one account.
- National Post ePaper, an electronic replica of the print edition to view on any device, share and comment on.
- Daily puzzles, including the New York Times Crossword.
REGISTER / SIGN IN TO UNLOCK MORE ARTICLES
Create an account or sign in to continue with your reading experience.
- Access articles from across Canada with one account.
- Share your thoughts and join the conversation in the comments.
- Enjoy additional articles per month.
- Get email updates from your favourite authors.
THIS ARTICLE IS FREE TO READ REGISTER TO UNLOCK.
Create an account or sign in to continue with your reading experience.
- Access articles from across Canada with one account
- Share your thoughts and join the conversation in the comments
- Enjoy additional articles per month
- Get email updates from your favourite authors
Sign In or Create an Account
or
Article content
“July was a good month for Madsen and our mine operations team, and we continue to track to plan on our ramp up,” said Shane Williams, President and CEO. “Mine ramp-up is about adding equipment, developing access to high-priority mining areas, and increasing operational efficiency until the mine consistently produces the targeted daily tonnage at the targeted grade. During July, all these ramp-up elements played a positive role at Madsen. The mill achieved an average of 94% recovery over the month while processing 500-800 tonnes per day. Additionally, material mined from sill access development carried gold grades well above expectation on several occasions. Collectively, this enabled Madsen to pour 3,800 ounces for the month of July.”
Article content
Article content
Article content
July Production
Article content
By signing up you consent to receive the above newsletter from Postmedia Network Inc.
Article content
In July the Madsen mine operations team completed sill development and mining in eight (8) areas spread across McVeigh, South Austin, and Austin. Sill development was a priority in the month, to enable a focus on stope mining in August. Mill feed in July was therefore a mix of mined material and low-grade stockpiles. Mined material carried an average grade of 8.9 grams per tonne gold. Since sill mining is less efficient than stope mining in terms of producing tonnage, mined tonnage was combined with low grade stockpile to produce an average grade of around 5g/t going into the mill.
Article content
Three (3) gold pours took place over the month to produce 3,800 ounces of gold. Of that, 3,595 ounces were sold at an average price of US$3,320 per oz. to generate US$12 million ($C16.4M) in revenues.
Article content
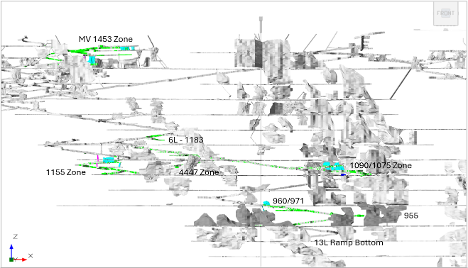
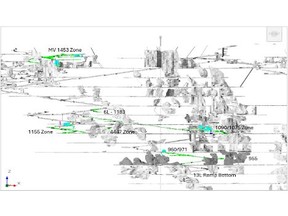
Figure 1. Long section of the Madsen Mine showing the eight areas of active mining, sill development, and access development through the month of July 2025.
Article content
Continued Strong Stope Reconciliation
Article content
Tightening drill hole spacing from 20 metres to 7 metres (average distances) to inform an in-house resource model of high accuracy and resolution prior to final stope design is fundamental to West Red Lake Gold’s approach to mining at Madsen. The mineralized system at Madsen has been altered and deformed, resulting in gold mineralization that is high grade and pervasive but not always continuous. Tight definition drilling to inform an accurate geologic model is essential for better understanding grade continuity in the deposit.
Article content
Article content
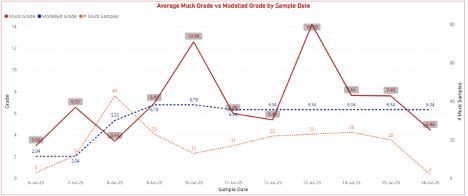
The effectiveness of this approach was apparent in the close reconciliation between expected and actual grades and tonnes in the bulk sample (see May 7 news release). Figure 2 below shows a similar degree of reconciliation for a recently mined stope in McVeigh. Expected or modeled grade is shown in blue. Average grade mined is shown in red. Number of muck samples taken is shown in orange.
Article content
Article content
Article content
Article content
Figure 2. Muck grade versus modelled grade by sample date for a long-hole stope in the McVeigh area mined in July.
Article content
July Sill Grade Performance
Article content
Stope areas at Madsen are drill tested to 7-metre spacing. Sills, which are the access levels developed above and below stopes to create access to mine, are not always drilled to 7-metre spacing because of stope and drill bay geometry. In addition, chip sampling along sills adds data to the model before stopes are mined. As a result of these two factors, sills are expected to return higher grade variability versus the model than stopes.
Article content
Such variability is shown in Figure 3 below, which is a summary generated weekly at site by the Production Geology team that shows the number of sill development rounds that were expected to generate high grade (red), low grade (green), and waste (blue) material and the actual grades achieved for each kind of material.
 English (US)