
.jpg) 1 hour ago
2
1 hour ago
2
Feb 09, 2026, 07:36:31 AM IST

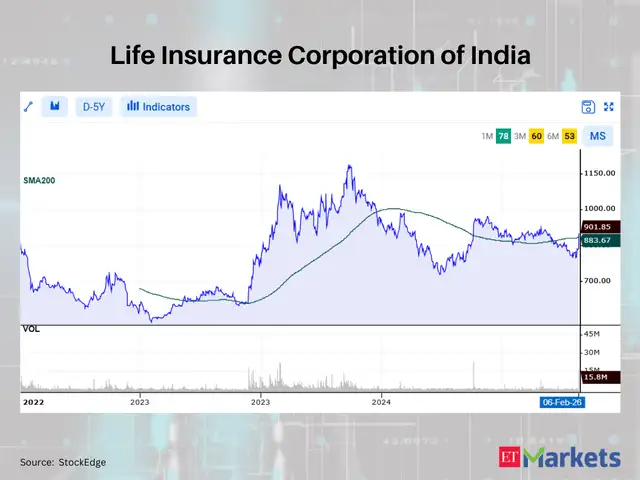
In the Nifty500 pack, 12 stocks’ closing prices crossed above their 200 DMA (Daily Moving Averages) on February 06, 2026, according to StockEdge.com’s technical scan data. The 200-day daily moving average (DMA) is used by traders as a key indicator for determining the overall trend in a particular stock. As long as a stock is priced above the 200-day SMA on the daily timeframe, it is generally considered to be in an overall uptrend. Take a look:
ETMarkets.com
2/13
Life Insurance Corporation of India
200 DMA: Rs 883.67 | LTP: Rs 901.85
Agencies
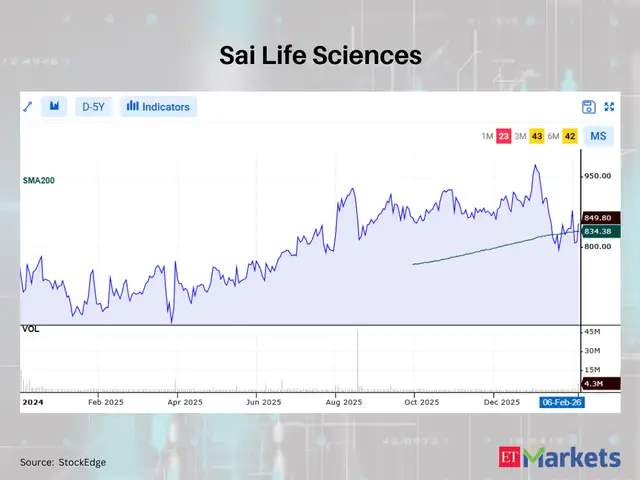
200 DMA: Rs 834.38 | LTP: Rs 849.8
Agencies
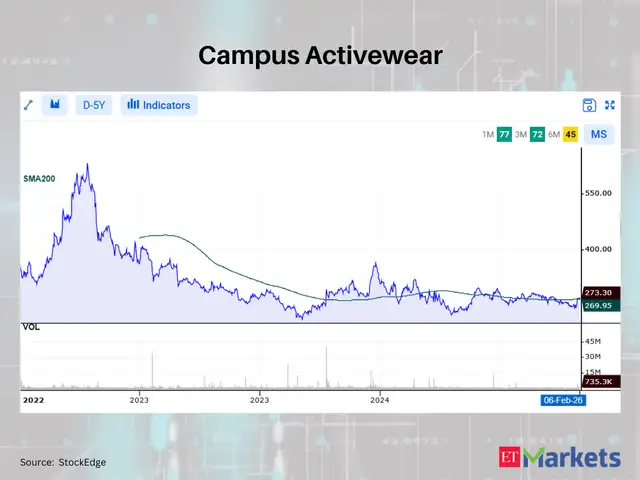
200 DMA: Rs 269.95 | LTP: Rs 273.3
Agencies
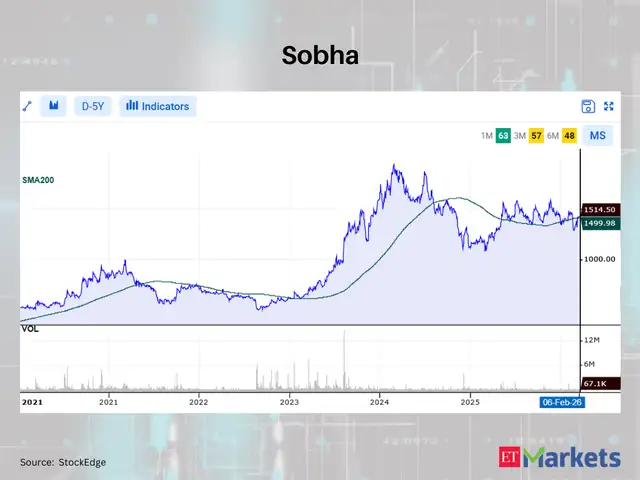
200 DMA: Rs 1,499.98 | LTP: Rs 1,514.5
Agencies
6/13
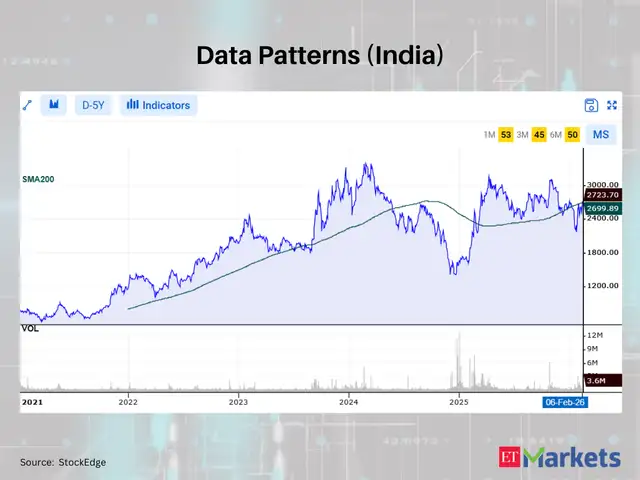
Data Patterns (India)
200 DMA: Rs 2,699.89 | LTP: Rs 2,723.7
Agencies
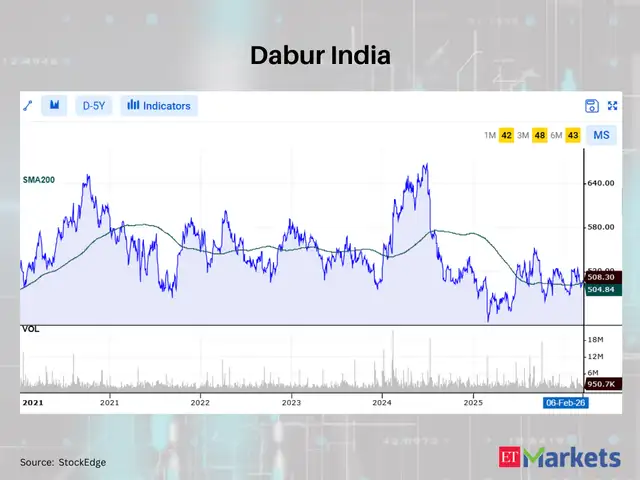
200 DMA: Rs 504.84 | LTP: Rs 508.3
Agencies
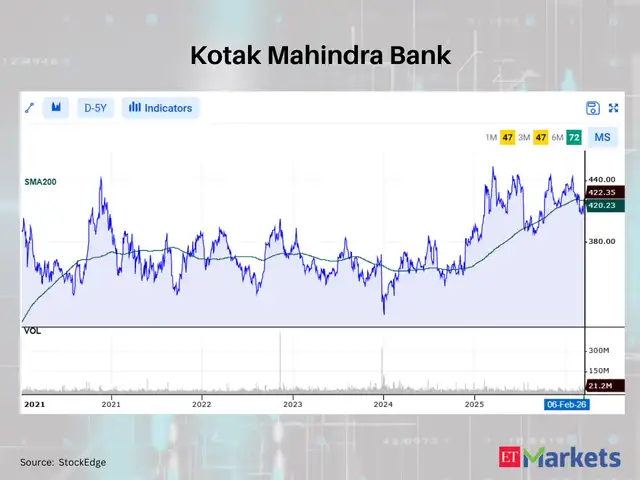
200 DMA: Rs 420.23 | LTP: Rs 422.35
Agencies
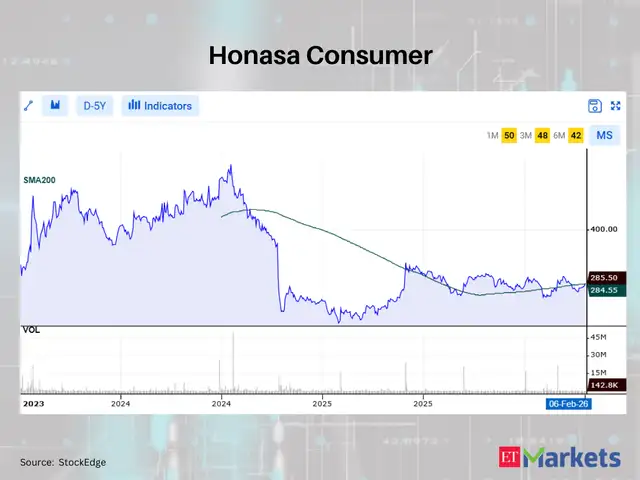
200 DMA: Rs 284.55 | LTP: Rs 285.5
Agencies
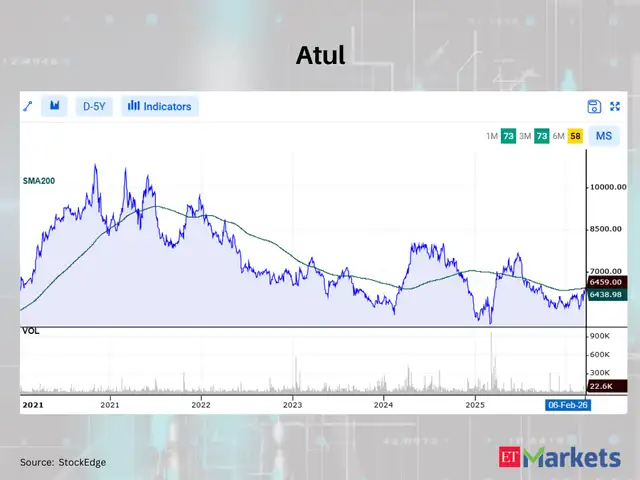
200 DMA: Rs 6,438.98 | LTP: Rs 6,459
Agencies
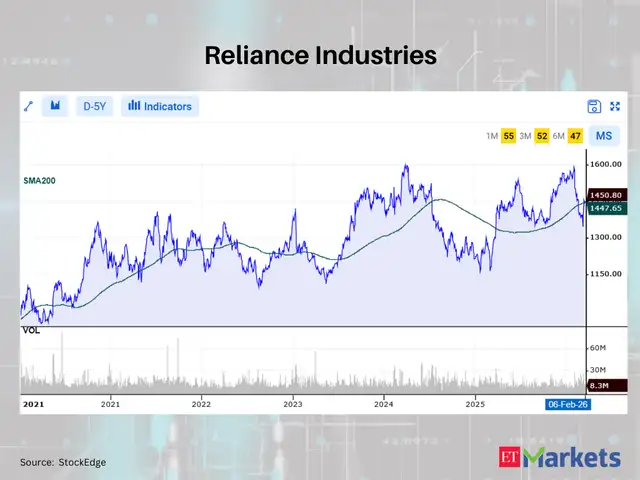
200 DMA: Rs 1,447.66 | LTP: Rs 1,450.8
Agencies
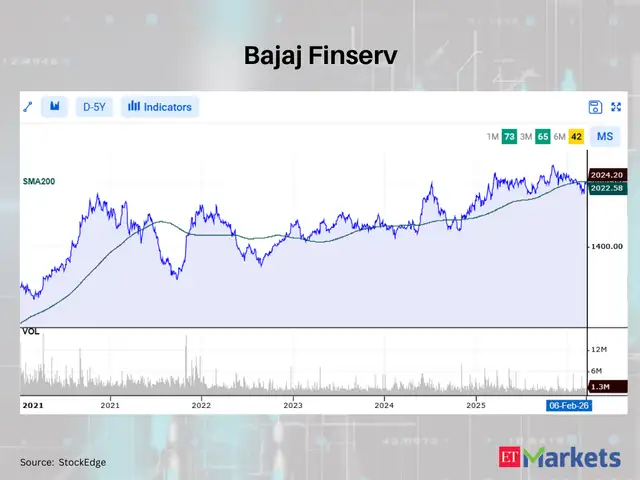
200 DMA: Rs 2,022.58 | LTP: Rs 2,024.2
Agencies
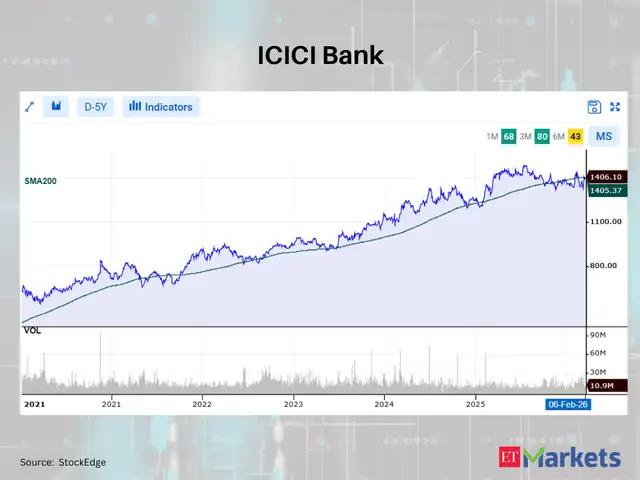
200 DMA: Rs 1,405.37 | LTP: Rs 1,406.1
Agencies
 English (US)