
.jpg) 2 hours ago
1
2 hours ago
1
Article content
Adjusted EBITDA and Adjusted EBITDA Margin
Article content
The Company believes that, in addition to conventional measures prepared in accordance with IFRS, adjusted EBITDA is useful to securities analysts, investors and other interested parties in evaluating operating performance by presenting the results of the Company on a basis which excludes the impact of certain non-operational items which enables the primary readers of the press release to evaluate the results of the Company such that it was operating without certain non-cash and non-recurring items. Adjusted EBITDA is calculated as earnings before interest expense, interest income, income taxes, depreciation and amortization, stock-based compensation expense and non-recurring impact transactions, if any.
Article content
| ($ 000s) | Q4 2024 | Q4 2023 | 2024 | 2023 | ||||
| Net Income | 13,674 | 2,584 | 20,089 | 5,547 | ||||
| Income Tax | (8,549 | ) | 482 | (8,061 | ) | 776 | ||
| Financing costs | 852 | 369 | 2,435 | 1,631 | ||||
| Interest income | (688 | ) | – | (688 | ) | – | ||
| Foreign exchange loss (gain) | (369 | ) | 997 | 43 | 975 | |||
| Share-based compensation | 447 | 58 | 948 | 378 | ||||
| Loss on disposal of assets | 0 | 1 | (3 | ) | 3 | |||
| Impairment of goodwill | – | – | – | 2,757 | ||||
| Gain on extinguishment of contingent consideration | – | – | – | (4,044 | ) | |||
| Depreciation and amortization | 1,498 | 1,236 | 5,726 | 4,940 | ||||
| EBITDA – excluding restructuring and acquisition costs | 6,865 | 5,727 | 20,489 | 12,963 | ||||
| Restructuring and acquisition costs | 155 | – | 224 | 1,131 | ||||
| Adjusted EBITDA | 7,020 | 5,727 | 20,713 | 14,094 | ||||
| Adjusted EBITDA Margin | 25 | % | 20 | % | 23 | % | 20 | % |
Article content
Article content
Gross profit is defined as revenue less cost of total sales. Gross margin is defined as gross margin dividend by total sales.
Article content
| Q4 2024 | Q4 2023 | 2024 | 2023 | |||||
| Revenue | 28,109 | 28,006 | 91,292 | 69,581 | ||||
| Cost of sales | 14,627 | 16,292 | 46,600 | 35,625 | ||||
| Gross profit | 13,482 | 11,714 | 44,692 | 33,956 | ||||
| Gross profit margin (%) | 48 | % | 42 | % | 49 | % | 49 | % |
Article content
Webcast Details
Article content
Article content
A recording of the webcast and supporting materials will be made available in the investor’s section of the Company’s website at https://www.krakenrobotics.com/investors.
Article content
Article content
Article content
Article content
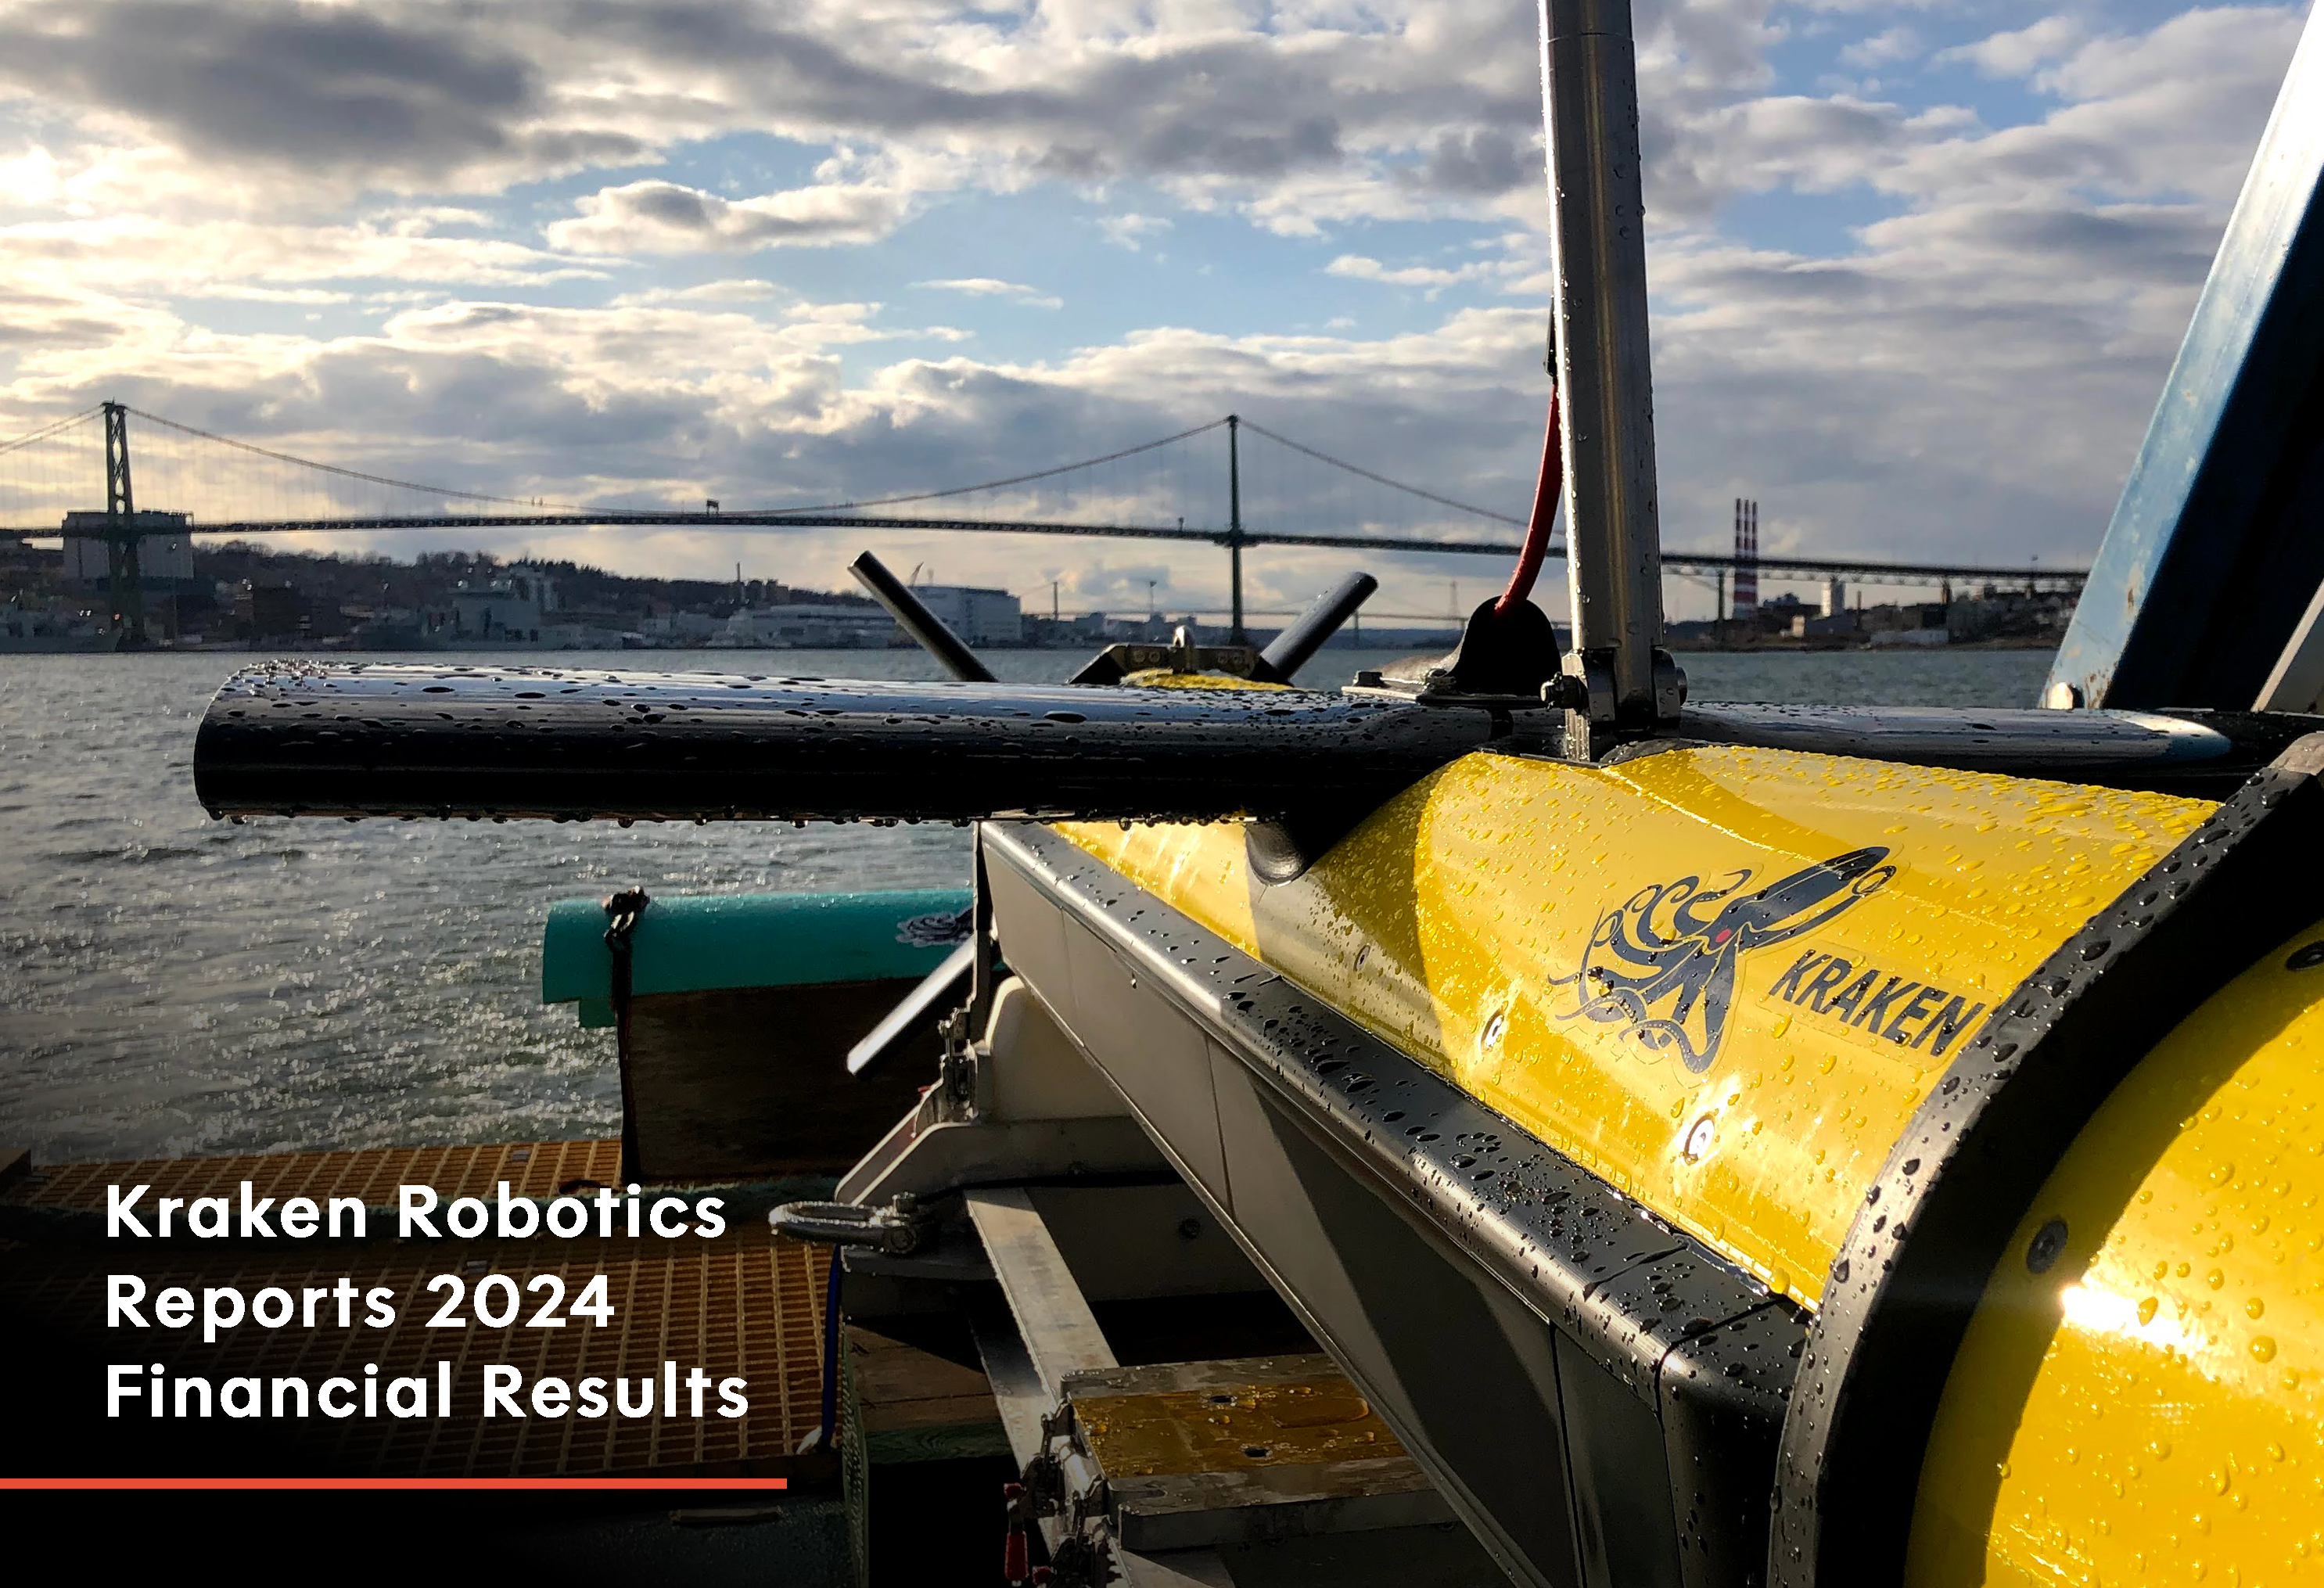
Figure 1: KATFISH towed synthetic aperture sonar system returning from testing in Halifax Harbour
Article content
ABOUT KRAKEN ROBOTICS INC.
Article content
Kraken Robotics Inc. (TSX.V: PNG) (OTCQB: KRKNF) is transforming subsea intelligence through 3D imaging sensors, power solutions, and robotic systems. Our products and services enable clients to overcome the challenges in our oceans – safely, efficiently, and sustainably.
Article content
Article content
Kraken’s synthetic aperture sonar, sub-bottom imaging, and LiDAR systems offer best-in-class resolution, providing critical insights into ocean safety, infrastructure, and geology. Our revolutionary pressure tolerant batteries deliver high energy density power for UUVs and subsea energy storage.
Article content
Kraken Robotics is headquartered in Canada with offices in North America, South America, and Europe, supporting clients in more than 30 countries worldwide.
Article content
LINKS:
Article content
Article content
SOCIAL MEDIA:
Article content
Article content
FORWARD LOOKING STATEMENTS
Article content
The Company and its management believe that the statements regarding 2025 revenue and adjusted EBITDA contained in this press release are reasonable as of the date hereof, are based on management’s current views, strategies, expectations, assumptions and forecasts, and have been calculated using accounting policies that are generally consistent with the Company’s current accounting policies. These statements are considered future-oriented financial outlooks and financial information (collectively, “FOFI”) under applicable securities laws. These statements and any other FOFI included herein have been approved by management of the Company as of the date hereof. Such FOFI are provided for the purposes of presenting information about management’s current expectations and goals relating to the Company’s expected growth in its Products and Services groups. However, because this information is highly subjective and subject to numerous risks, including the risks discussed in the disclaimer for forward-looking statements below, it should not be relied on as necessarily indicative of future results. Should one or more of these risks or uncertainties materialize, or should assumptions underlying the FOFI prove incorrect, actual results may vary materially from those described herein as intended, planned, anticipated, believed, estimated or expected. Although management of the Company has attempted to identify important risks, uncertainties and factors which could cause actual results to differ materially, there may be others that cause results not to be as anticipated, estimated or intended. The Company disclaims any intention or obligation to update or revise any FOFI, whether as a result of new information, future events or otherwise, except as required by securities laws.
 English (US)