
.jpg) 2 hours ago
1
2 hours ago
1
Article content
| Consolidated balance sheets | ||||||||||
| (unaudited, expressed in millions of U.S. dollars, except share amounts) | ||||||||||
| As at | ||||||||||
| September 30, | December 31, | |||||||||
| 2025 | 2024 | |||||||||
| Assets | ||||||||||
| Current assets | ||||||||||
| Cash and cash equivalents | $ | 1,721.7 | $ | 611.5 | ||||||
| Restricted cash | 14.2 | 10.2 | ||||||||
| Accounts receivable and prepaid assets | 154.0 | 257.3 | ||||||||
| Inventories | 1,381.2 | 1,243.2 | ||||||||
| Other current assets | 142.7 | 4.5 | ||||||||
| 3,413.8 | 2,126.7 | |||||||||
| Non-current assets | ||||||||||
| Property, plant and equipment | 8,047.3 | 7,968.6 | ||||||||
| Long-term investments | 71.1 | 51.9 | ||||||||
| Other long-term assets | 597.8 | 713.1 | ||||||||
| Deferred tax assets | – | 5.3 | ||||||||
| Total assets | $ | 12,130.0 | $ | 10,865.6 | ||||||
| Liabilities | ||||||||||
| Current liabilities | ||||||||||
| Accounts payable and accrued liabilities | $ | 700.4 | $ | 543.0 | ||||||
| Current income tax payable | 442.1 | 236.7 | ||||||||
| Current portion of long-term debt | – | 199.9 | ||||||||
| Current portion of provisions | 51.0 | 62.5 | ||||||||
| Other current liabilities | 12.8 | 18.0 | ||||||||
| 1,206.3 | 1,060.1 | |||||||||
| Non-current liabilities | ||||||||||
| Long-term debt | 1,236.9 | 1,235.5 | ||||||||
| Provisions | 977.2 | 941.5 | ||||||||
| Other long-term liabilities | 55.6 | 78.9 | ||||||||
| Deferred tax liabilities | 571.1 | 549.0 | ||||||||
| Total liabilities | $ | 4,047.1 | $ | 3,865.0 | ||||||
| Equity | ||||||||||
| Common shareholders’ equity | ||||||||||
| Common share capital | $ | 4,419.0 | $ | 4,487.3 | ||||||
| Contributed surplus | 10,369.6 | 10,643.0 | ||||||||
| Accumulated deficit | (6,807.7 | ) | (8,181.3 | ) | ||||||
| Accumulated other comprehensive loss | (24.0 | ) | (87.4 | ) | ||||||
| Total common shareholders’ equity | 7,956.9 | 6,861.6 | ||||||||
| Non-controlling interests | 126.0 | 139.0 | ||||||||
| Total equity | $ | 8,082.9 | $ | 7,000.6 | ||||||
| Total liabilities and equity | $ | 12,130.0 | $ | 10,865.6 | ||||||
| Common shares | ||||||||||
| Authorized | Unlimited | Unlimited | ||||||||
| Issued and outstanding | 1,209,993,934 | 1,229,125,606 | ||||||||
Article content
Article content
| Consolidated statements of operations | ||||||||||||||||||
| (unaudited, expressed in millions of U.S. dollars, except per share amounts) | ||||||||||||||||||
| Three months ended | Nine months ended | |||||||||||||||||
| September 30, | September 30, | September 30, | September 30, | |||||||||||||||
| 2025 | 2024 | 2025 | 2024 | |||||||||||||||
| Revenue | ||||||||||||||||||
| Metal sales | $ | 1,802.1 | $ | 1,432.0 | $ | 5,028.1 | $ | 3,733.0 | ||||||||||
| Cost of sales | ||||||||||||||||||
| Production cost of sales | 598.6 | 564.3 | 1,713.7 | 1,613.3 | ||||||||||||||
| Depreciation, depletion and amortization | 285.4 | 296.2 | 836.7 | 862.7 | ||||||||||||||
| Impairment reversal | – | (74.1 | ) | – | (74.1 | ) | ||||||||||||
| Total cost of sales | 884.0 | 786.4 | 2,550.4 | 2,401.9 | ||||||||||||||
| Gross profit | 918.1 | 645.6 | 2,477.7 | 1,331.1 | ||||||||||||||
| Other operating expense | 26.1 | 21.1 | 71.2 | 50.6 | ||||||||||||||
| Exploration and business development | 50.7 | 49.6 | 154.7 | 147.0 | ||||||||||||||
| General and administrative | 31.2 | 27.2 | 96.5 | 94.3 | ||||||||||||||
| Operating earnings | 810.1 | 547.7 | 2,155.3 | 1,039.2 | ||||||||||||||
| Other income (expense) – net | 16.8 | (6.0 | ) | (16.2 | ) | (0.2 | ) | |||||||||||
| Finance income | 45.2 | 6.3 | 56.8 | 14.7 | ||||||||||||||
| Finance expense | (30.7 | ) | (23.5 | ) | (98.8 | ) | (66.8 | ) | ||||||||||
| Earnings before tax | 841.4 | 524.5 | 2,097.1 | 986.9 | ||||||||||||||
| Income tax expense – net | (232.3 | ) | (134.2 | ) | (540.0 | ) | (281.1 | ) | ||||||||||
| Net earnings | $ | 609.1 | $ | 390.3 | $ | 1,557.1 | $ | 705.8 | ||||||||||
| Net earnings attributable to: | ||||||||||||||||||
| Non-controlling interests | $ | 24.2 | $ | 35.0 | $ | 73.5 | $ | 32.6 | ||||||||||
| Common shareholders | $ | 584.9 | $ | 355.3 | $ | 1,483.6 | $ | 673.2 | ||||||||||
| Earnings per share attributable to common shareholders | ||||||||||||||||||
| Basic | $ | 0.48 | $ | 0.29 | $ | 1.21 | $ | 0.55 | ||||||||||
| Diluted | $ | 0.48 | $ | 0.29 | $ | 1.21 | $ | 0.55 | ||||||||||
Article content
| Consolidated statements of cash flows | ||||||||||||||||||
| (unaudited, expressed in millions of U.S. dollars) | ||||||||||||||||||
| Three months ended | Nine months ended | |||||||||||||||||
| September 30, | September 30, | September 30, | September 30, | |||||||||||||||
| 2025 | 2024 | 2025 | 2024 | |||||||||||||||
| Net inflow (outflow) of cash related to the following activities: | ||||||||||||||||||
| Operating: | ||||||||||||||||||
| Net earnings | $ | 609.1 | $ | 390.3 | $ | 1,557.1 | $ | 705.8 | ||||||||||
| Adjustments to reconcile net earnings to net cash provided from operating activities: | ||||||||||||||||||
| Depreciation, depletion and amortization | 285.4 | 296.2 | 836.7 | 862.7 | ||||||||||||||
| Impairment reversal | – | (74.1 | ) | – | (74.1 | ) | ||||||||||||
| Share-based compensation expense | 3.4 | 1.3 | 11.2 | 6.6 | ||||||||||||||
| Finance expense | 30.7 | 23.5 | 98.8 | 66.8 | ||||||||||||||
| Deferred tax expense | 32.9 | 21.6 | 35.4 | 9.0 | ||||||||||||||
| Gain on sale of Asante Gold Corporation holdings | (63.0 | ) | – | (63.0 | ) | – | ||||||||||||
| Foreign exchange (gains) losses and other | (16.3 | ) | 8.9 | (8.0 | ) | 16.8 | ||||||||||||
| Changes in operating assets and liabilities: | ||||||||||||||||||
| Accounts receivable and other assets | (48.0 | ) | (30.9 | ) | (33.7 | ) | (15.9 | ) | ||||||||||
| Inventories | (19.9 | ) | (11.5 | ) | (49.4 | ) | (3.1 | ) | ||||||||||
| Accounts payable, accrued liabilities and other | 267.1 | 127.4 | 574.1 | 288.0 | ||||||||||||||
| Cash flow provided from operating activities | 1,081.4 | 752.7 | 2,959.2 | 1,862.6 | ||||||||||||||
| Income taxes paid | (57.3 | ) | (19.2 | ) | (345.6 | ) | (150.7 | ) | ||||||||||
| Net cash flow provided from operating activities | 1,024.1 | 733.5 | 2,613.6 | 1,711.9 | ||||||||||||||
| Investing: | ||||||||||||||||||
| Additions to property, plant and equipment | (312.2 | ) | (278.7 | ) | (826.0 | ) | (794.8 | ) | ||||||||||
| Interest paid capitalized to property, plant and equipment | (4.5 | ) | (33.0 | ) | (18.0 | ) | (84.9 | ) | ||||||||||
| Proceeds from long-term investments and other assets | 94.3 | – | 94.3 | 4.8 | ||||||||||||||
| Additions to long-term investments and other assets | (12.5 | ) | (11.4 | ) | (36.4 | ) | (35.0 | ) | ||||||||||
| Increase in restricted cash – net | (1.5 | ) | (1.3 | ) | (4.0 | ) | (1.0 | ) | ||||||||||
| Interest received and other – net | 11.1 | 6.0 | 24.3 | 13.7 | ||||||||||||||
| Net cash flow of continuing operations used in investing activities | (225.3 | ) | (318.4 | ) | (765.8 | ) | (897.2 | ) | ||||||||||
| Net cash flow of discontinued operations provided from investing activities | 53.4 | – | 53.4 | – | ||||||||||||||
| Financing: | ||||||||||||||||||
| Repayment of debt | – | (350.0 | ) | (200.0 | ) | (550.0 | ) | |||||||||||
| Interest paid | (31.0 | ) | (17.1 | ) | (55.0 | ) | (35.6 | ) | ||||||||||
| Payment of lease liabilities | (2.0 | ) | (3.3 | ) | (5.0 | ) | (10.1 | ) | ||||||||||
| Funding from non-controlling interest | – | 4.1 | – | 31.3 | ||||||||||||||
| Distributions paid to non-controlling interest | (33.0 | ) | (19.5 | ) | (87.0 | ) | (19.5 | ) | ||||||||||
| Dividends paid to common shareholders | (36.4 | ) | (36.9 | ) | (110.0 | ) | (110.6 | ) | ||||||||||
| Repurchase and cancellation of shares | (165.1 | ) | – | (335.2 | ) | – | ||||||||||||
| Other – net | – | 0.1 | – | 0.4 | ||||||||||||||
| Net cash flow used in financing activities | (267.5 | ) | (422.6 | ) | (792.2 | ) | (694.1 | ) | ||||||||||
| Effect of exchange rate changes on cash and cash equivalents | 0.5 | 0.3 | 1.2 | (0.2 | ) | |||||||||||||
| Increase (decrease) in cash and cash equivalents | 585.2 | (7.2 | ) | 1,110.2 | 120.4 | |||||||||||||
| Cash and cash equivalents, beginning of period | 1,136.5 | 480.0 | 611.5 | 352.4 | ||||||||||||||
| Cash and cash equivalents, end of period | $ | 1,721.7 | $ | 472.8 | $ | 1,721.7 | $ | 472.8 | ||||||||||
Article content
| Operating Summary | |||||||||||||||||||
| Mine | Period | Tonnes Ore Mined | Ore Processed (Milled) | Ore Processed (Heap Leach) | Grade (Mill) | Grade (Heap Leach) | Recovery(a)(b) | Gold Eq Production(c) | Gold Eq Sales(c) | Production cost of sales | Production cost of sales/oz(d) | Cap Ex – sustaining(e) | Total Cap Ex(e) | ||||||
| (‘000 tonnes) | (‘000 tonnes) | (‘000 tonnes) | (g/t) | (g/t) | (%) | (ounces) | (ounces) | ($ millions) | ($/ounce) | ($ millions) | ($ millions) | ||||||||
| West Africa | Tasiast | Q3 2025 | 1,685 | 2,181 | – | 1.78 | – | 94 | % | 120,934 | 116,251 | $ | 103.4 | $ | 889 | $ | 47.6 | $ | 102.0 |
| Q2 2025 | 1,921 | 1,730 | – | 2.11 | – | 95 | % | 119,241 | 121,745 | $ | 102.6 | $ | 843 | $ | 23.1 | $ | 89.7 | ||
| Q1 2025 | 1,812 | 1,932 | – | 2.15 | – | 95 | % | 137,629 | 129,493 | $ | 105.0 | $ | 811 | $ | 13.7 | $ | 80.1 | ||
| Q4 2024 | 1,824 | 2,205 | – | 2.13 | – | 94 | % | 139,411 | 144,041 | $ | 104.4 | $ | 725 | $ | 33.7 | $ | 105.4 | ||
| Q3 2024 | 1,748 | 2,203 | – | 2.46 | – | 91 | % | 162,155 | 158,521 | $ | 109.0 | $ | 688 | $ | 13.5 | $ | 83.8 | ||
| Americas | Paracatu | Q3 2025 | 12,958 | 13,214 | – | 0.44 | – | 82 | % | 150,367 | 149,903 | $ | 139.9 | $ | 933 | $ | 58.2 | $ | 58.2 |
| Q2 2025 | 13,497 | 14,527 | – | 0.39 | – | 82 | % | 149,264 | 148,787 | $ | 142.6 | $ | 958 | $ | 38.4 | $ | 38.4 | ||
| Q1 2025 | 13,318 | 12,507 | – | 0.43 | – | 83 | % | 146,639 | 146,855 | $ | 139.6 | $ | 951 | $ | 24.4 | $ | 24.4 | ||
| Q4 2024 | 12,944 | 13,116 | – | 0.40 | – | 80 | % | 123,899 | 124,690 | $ | 131.6 | $ | 1,055 | $ | 35.1 | $ | 35.1 | ||
| Q3 2024 | 13,127 | 14,551 | – | 0.38 | – | 81 | % | 146,174 | 145,235 | $ | 146.1 | $ | 1,006 | $ | 41.2 | $ | 41.2 | ||
| La Coipa(f) | Q3 2025 | 1,006 | 932 | – | 2.36 | – | 76 | % | 57,997 | 57,544 | $ | 69.0 | $ | 1,199 | $ | 18.5 | $ | 18.5 | |
| Q2 2025 | 580 | 911 | – | 1.77 | – | 78 | % | 54,139 | 50,400 | $ | 70.4 | $ | 1,397 | $ | 25.0 | $ | 25.0 | ||
| Q1 2025 | 1,265 | 971 | – | 2.19 | – | 80 | % | 52,315 | 55,870 | $ | 64.1 | $ | 1,147 | $ | 15.6 | $ | 15.6 | ||
| Q4 2024 | 1,385 | 1,017 | – | 1.98 | – | 79 | % | 58,533 | 57,852 | $ | 68.2 | $ | 1,179 | $ | 26.6 | $ | 26.6 | ||
| Q3 2024 | 786 | 809 | – | 2.17 | – | 80 | % | 50,502 | 48,594 | $ | 52.2 | $ | 1,074 | $ | 21.3 | $ | 24.9 | ||
| Fort Knox (100%)(g) | Q3 2025 | 8,140 | 1,511 | 6,538 | 1.86 | 0.23 | 90 | % | 112,181 | 117,500 | $ | 159.7 | $ | 1,359 | $ | 45.0 | $ | 45.0 | |
| Q2 2025 | 7,639 | 1,636 | 5,529 | 1.72 | 0.23 | 88 | % | 115,064 | 113,200 | $ | 141.3 | $ | 1,248 | $ | 43.0 | $ | 43.0 | ||
| Q1 2025 | 6,530 | 1,071 | 4,790 | 2.77 | 0.19 | 91 | % | 112,054 | 112,110 | $ | 131.8 | $ | 1,176 | $ | 28.2 | $ | 28.2 | ||
| Q4 2024 | 7,692 | 1,524 | 6,664 | 1.51 | 0.21 | 82 | % | 104,901 | 108,512 | $ | 141.0 | $ | 1,299 | $ | 53.3 | $ | 54.0 | ||
| Q3 2024 | 7,612 | 1,105 | 5,822 | 4.03 | 0.19 | 91 | % | 149,093 | 140,121 | $ | 134.2 | $ | 958 | $ | 56.6 | $ | 70.4 | ||
| Fort Knox (attributable)(g) | Q3 2025 | 8,056 | 1,425 | 6,538 | 1.55 | 0.23 | 89 | % | 95,742 | 100,878 | $ | 138.4 | $ | 1,372 | $ | 40.4 | $ | 40.4 | |
| Q2 2025 | 7,535 | 1,567 | 5,529 | 1.47 | 0.23 | 87 | % | 97,561 | 95,277 | $ | 118.8 | $ | 1,247 | $ | 38.7 | $ | 38.7 | ||
| Q1 2025 | 6,445 | 982 | 4,790 | 2.35 | 0.19 | 90 | % | 94,281 | 94,585 | $ | 111.1 | $ | 1,175 | $ | 24.6 | $ | 24.6 | ||
| Q4 2024 | 7,619 | 1,483 | 6,664 | 1.28 | 0.21 | 81 | % | 91,755 | 94,763 | $ | 125.1 | $ | 1,320 | $ | 51.1 | $ | 52.1 | ||
| Q3 2024 | 7,509 | 991 | 5,822 | 3.44 | 0.19 | 91 | % | 119,500 | 112,346 | $ | 109.3 | $ | 973 | $ | 55.4 | $ | 67.2 | ||
| Round Mountain | Q3 2025 | 1,659 | 914 | 1,113 | 0.66 | 0.32 | 72 | % | 37,297 | 37,274 | $ | 78.1 | $ | 2,095 | $ | 4.5 | $ | 33.0 | |
| Q2 2025 | 2,881 | 856 | 1,682 | 0.72 | 0.30 | 80 | % | 38,665 | 37,864 | $ | 52.1 | $ | 1,376 | $ | 5.7 | $ | 32.8 | ||
| Q1 2025 | 1,927 | 856 | 2,163 | 0.66 | 0.27 | 77 | % | 35,686 | 35,960 | $ | 57.0 | $ | 1,585 | $ | 2.8 | $ | 29.6 | ||
| Q4 2024 | 3,111 | 768 | 1,736 | 1.05 | 0.22 | 82 | % | 42,969 | 45,342 | $ | 80.0 | $ | 1,764 | $ | 4.4 | $ | 33.9 | ||
| Q3 2024 | 2,958 | 790 | 1,032 | 0.74 | 0.29 | 80 | % | 42,279 | 41,436 | $ | 63.8 | $ | 1,540 | $ | 5.2 | $ | 35.9 | ||
| Bald Mountain | Q3 2025 | 2,182 | – | 2,182 | – | 0.31 | nm | 41,525 | 42,261 | $ | 48.5 | $ | 1,148 | $ | 5.3 | $ | 27.9 | ||
| Q2 2025 | 1,578 | – | 1,578 | – | 1.07 | nm | 53,704 | 54,227 | $ | 59.4 | $ | 1,095 | $ | 12.7 | $ | 40.4 | |||
| Q1 2025 | 5,803 | – | 5,803 | – | 0.35 | nm | 45,538 | 43,801 | $ | 49.2 | $ | 1,123 | $ | 6.9 | $ | 17.8 | |||
| Q4 2024 | 7,622 | – | 7,622 | – | 0.46 | nm | 44,642 | 51,291 | $ | 58.7 | $ | 1,144 | $ | 4.6 | $ | 6.4 | |||
| Q3 2024 | 6,384 | – | 6,384 | – | 0.53 | nm | 43,496 | 44,410 | $ | 58.9 | $ | 1,326 | $ | 5.0 | $ | 6.1 | |||
Article content
| (a) | Due to the nature of heap leach operations, recovery rates at Bald Mountain cannot be accurately measured on a quarterly basis. Recovery rates at Fort Knox and Round Mountain represent mill recovery only. | |
| (b) | “nm” means not meaningful. | |
| (c) | Gold equivalent ounces include silver ounces produced and sold converted to a gold equivalent based on the ratio of the average spot market prices for the commodities for each period. The ratios for the quarters presented are as follows: Q3 2025: 87.73:1; Q2 2025: 97.41:1; Q1 2025: 89.69:1; Q4 2024: 84.67:1; Q3 2024: 84.06:1. | |
| (d) | “Production cost of sales per equivalent ounce sold” is defined as production cost of sales divided by total gold equivalent ounces sold. | |
| (e) | “Total Cap Ex” is as reported as “Additions to property, plant and equipment” on the interim condensed consolidated statements of cash flows. “Cap Ex – sustaining” is a non-GAAP financial measure. The definition and reconciliation of this non-GAAP financial measure is included on pages 20 to 21 of this news release. | |
| (f) | La Coipa silver grade and recovery were as follows: Q3 2025: 41.34 g/t, 49%; Q2 2025: 28.89 g/t, 50%; Q1 2025: 31.97 g/t, 60%; Q4 2024: 42.57 g/t, 43%; Q3 2024: 49.13 g/t, 58%. | |
| (g) | The Fort Knox segment is composed of Fort Knox and Manh Choh. Manh Choh tonnes of ore processed and grade were as follows: Q3 2025: 286,496 tonnes, 7.05 g/t; Q2 2025: 231,451 tonnes, 7.39 g/t; Q1 2025: 294,238 tonnes, 7.39 g/t; Q4 2024: 138,937 tonnes, 9.58 g/t; Q3 2024: 379,786 tonnes, 9.13 g/t. The attributable results for Fort Knox include 100% of Fort Knox and 70% of Manh Choh. | |
Article content
Reconciliation of non-GAAP financial measures and ratios
Article content
The Company has included certain non-GAAP financial measures and ratios in this document. These financial measures and ratios are not defined under IFRS and should not be considered in isolation. The Company believes that these financial measures and ratios, together with financial measures and ratios determined in accordance with IFRS, provide investors with an improved ability to evaluate the underlying performance of the Company. The inclusion of these financial measures and ratios is meant to provide additional information and should not be used as a substitute for performance measures prepared in accordance with IFRS. These financial measures and ratios are not necessarily standard and therefore may not be comparable to other issuers.
Article content
Adjusted Net Earnings and Adjusted Net Earnings per Share
Article content
Adjusted net earnings and adjusted net earnings per share are non-GAAP financial measures and ratios which determine the performance of the Company, excluding certain impacts which the Company believes are not reflective of the Company’s underlying performance for the reporting period, such as the impact of foreign exchange gains and losses, reassessment of prior year taxes and/or taxes otherwise not related to the current period, impairment charges (reversals), gains and losses and other one-time costs related to acquisitions, dispositions and other transactions, and non-hedge derivative gains and losses. Although some of the items are recurring, the Company believes that they are not reflective of the underlying operating performance of its current business and are not necessarily indicative of future operating results. Management believes that these measures and ratios, which are used internally to assess performance and in planning and forecasting future operating results, provide investors with the ability to better evaluate underlying performance, particularly since the excluded items are typically not included in public guidance. However, adjusted net earnings and adjusted net earnings per share measures and ratios are not necessarily indicative of net earnings and earnings per share measures and ratios as determined under IFRS.
Article content
The following table provides a reconciliation of net earnings to adjusted net earnings for the periods presented:
Article content
| (expressed in millions of U.S. dollars, except per share amounts) | Three months ended | Nine months ended | |||||||||||||
| September 30, | September 30, | ||||||||||||||
| 2025 | 2024 | 2025 | 2024 | ||||||||||||
| Net earnings attributable to common shareholders – as reported | $ | 584.9 | $ | 355.3 | $ | 1,483.6 | $ | 673.2 | |||||||
| Adjusting items: | |||||||||||||||
| Foreign exchange losses (gains) | 9.8 | 4.8 | 28.6 | (5.1 | ) | ||||||||||
| Foreign exchange (gains) losses on translation of tax basis and foreign exchange on deferred income taxes within income tax expense | (15.6 | ) | 7.7 | (36.6 | ) | 32.0 | |||||||||
| Taxes in respect of prior periods | 3.3 | (0.2 | ) | (1.3 | ) | (22.9 | ) | ||||||||
| Impairment reversal | – | (74.1 | ) | – | (74.1 | ) | |||||||||
| Gain on sale of Asante holdings(a) | (53.0 | ) | – | (53.0 | ) | – | |||||||||
| Tasiast mill fire related costs | – | – | 13.0 | – | |||||||||||
| Insurance recoveries | – | – | – | (22.9 | ) | ||||||||||
| Other(b) | 0.9 | 0.8 | 4.3 | 16.2 | |||||||||||
| Tax effects of the above adjustments | (0.7 | ) | 4.4 | (4.0 | ) | 1.9 | |||||||||
| (55.3 | ) | (56.6 | ) | (49.0 | ) | (74.9 | ) | ||||||||
| Adjusted net earnings | $ | 529.6 | $ | 298.7 | $ | 1,434.6 | $ | 598.3 | |||||||
| Weighted average number of common shares outstanding – Basic | 1,215.3 | 1,229.0 | 1,223.8 | 1,228.8 | |||||||||||
| Adjusted net earnings per share | $ | 0.44 | $ | 0.24 | $ | 1.17 | $ | 0.49 | |||||||
| Basic earnings per share attributable to common shareholders – as reported | $ | 0.48 | $ | 0.29 | $ | 1.21 | $ | 0.55 | |||||||
Article content
| (a) | The gain on sale of Asante holdings includes interest income of $21.8 million related to prior periods. | |
| (b) | Other includes various impacts, such as settlement provisions, one-time costs and credits at sites, restructuring costs, adjustments related to prior years as well as gains and losses on assets and hedges, which the Company believes are not reflective of the Company’s underlying performance for the reporting period. | |
Article content
Attributable Free Cash Flow
Article content
Attributable free cash flow is a non-GAAP financial measure and is defined as net cash flow provided from operating activities less attributable capital expenditures and non-controlling interest included in net cash flows provided from operating activities. The Company believes that this measure, which is used internally to evaluate the Company’s underlying cash generation performance and the ability to repay creditors and return cash to shareholders, provides investors with the ability to better evaluate the Company’s underlying performance. However, this measure is not necessarily indicative of operating earnings or net cash flow provided from operating activities as determined under IFRS.
Article content
The following table provides a reconciliation of attributable free cash flow for the periods presented:
Article content
| (expressed in millions of U.S. dollars) | Three months ended | Nine months ended | |||||||||||||
| September 30, | September 30, | ||||||||||||||
| 2025 | 2024 | 2025 | 2024 | ||||||||||||
| Net cash flow provided from operating activities – as reported | $ | 1,024.1 | $ | 733.5 | $ | 2,613.6 | $ | 1,711.9 | |||||||
| Adjusting items: | |||||||||||||||
| Attributable(a) capital expenditures | (307.6 | ) | (275.5 | ) | (813.5 | ) | (772.1 | ) | |||||||
| Non-controlling interest(b) cash flow from operating activities | (29.8 | ) | (43.4 | ) | (96.0 | ) | (34.0 | ) | |||||||
| Attributable(a) free cash flow | $ | 686.7 | $ | 414.6 | $ | 1,704.1 | $ | 905.8 | |||||||
Article content
See pages 21 and 22 for details of the footnotes referenced within the table above.
Article content
Attributable Adjusted Operating Cash Flow
Article content
Attributable adjusted operating cash flow is a non-GAAP financial measure and is defined as net cash flow provided from operating activities excluding changes in working capital, certain impacts which the Company believes are not reflective of the Company’s regular operating cash flow, and net cash flows provided from operating activities, net of working capital changes, relating to non-controlling interests. Working capital can be volatile due to numerous factors, including the timing of tax payments. The Company uses attributable adjusted operating cash flow internally as a measure of the underlying operating cash flow performance and future operating cash flow-generating capability of the Company. However, the attributable adjusted operating cash flow measure is not necessarily indicative of net cash flow provided from operating activities as determined under IFRS.
Article content
The following table provides a reconciliation of attributable adjusted operating cash flow for the periods presented:
Article content
| (expressed in millions of U.S. dollars) | Three months ended | Nine months ended | |||||||||||||
| September 30, | September 30, | ||||||||||||||
| 2025 | 2024 | 2025 | 2024 | ||||||||||||
| Net cash flow provided from operating activities – as reported | $ | 1,024.1 | $ | 733.5 | $ | 2,613.6 | $ | 1,711.9 | |||||||
| Adjusting items: | |||||||||||||||
| Insurance proceeds received in respect of prior years | – | – | – | (22.9 | ) | ||||||||||
| Working capital changes: | |||||||||||||||
| Accounts receivable and other assets | 48.0 | 30.9 | 33.7 | 15.9 | |||||||||||
| Inventories | 19.9 | 11.5 | 49.4 | 3.1 | |||||||||||
| Accounts payable, accrued liabilities and other, including income taxes paid | (209.8 | ) | (108.2 | ) | (228.5 | ) | (137.3 | ) | |||||||
| 882.2 | 667.7 | 2,468.2 | 1,570.7 | ||||||||||||
| Non-controlling interest(b) cash flow from operating activities, net of working capital changes | (37.0 | ) | (42.7 | ) | (102.9 | ) | (41.7 | ) | |||||||
| Attributable(a) adjusted operating cash flow | $ | 845.2 | $ | 625.0 | $ | 2,365.3 | $ | 1,529.0 | |||||||
Article content
See pages 21 and 22 for details of the footnotes referenced within the table above.
Article content
Attributable Average Realized Gold Price per Ounce
Article content
Attributable average realized gold price per ounce is a non-GAAP ratio which calculates the average price realized from gold sales attributable to the Company. The Company believes that this measure provides a more accurate measure with which to compare the Company’s gold sales performance to market gold prices. The following table provides a reconciliation of attributable average realized gold price per ounce for the periods presented:
Article content
| (expressed in millions of U.S. dollars, except ounces and average realized gold price per ounce) | Three months ended | Nine months ended | |||||||||||||
| September 30, | September 30, | ||||||||||||||
| 2025 | 2024 | 2025 | 2024 | ||||||||||||
| Metal sales – as reported | $ | 1,802.1 | $ | 1,432.0 | $ | 5,028.1 | $ | 3,733.0 | |||||||
| Less: silver revenue(c) | (32.3 | ) | (21.5 | ) | (77.4 | ) | (97.3 | ) | |||||||
| Less: non-controlling interest(b)gold revenue | (57.8 | ) | (67.5 | ) | (165.9 | ) | (67.5 | ) | |||||||
| Attributable(a)gold revenue | $ | 1,712.0 | $ | 1,343.0 | $ | 4,784.8 | $ | 3,568.2 | |||||||
| Gold ounces sold | 511,564 | 569,506 | 1,547,223 | 1,578,232 | |||||||||||
| Less: non-controlling interest(b)gold ounces sold | (16,428 | ) | (27,676 | ) | (51,575 | ) | (27,676 | ) | |||||||
| Attributable(a)gold ounces sold | 495,136 | 541,830 | 1,495,648 | 1,550,556 | |||||||||||
| Attributable(a)average realized gold price per ounce | $ | 3,458 | $ | 2,479 | $ | 3,199 | $ | 2,301 | |||||||
| Average realized gold price per ounce(d) | $ | 3,460 | $ | 2,477 | $ | 3,200 | $ | 2,304 | |||||||
Article content
See pages 21 and 22 for details of the footnotes referenced within the table above.
Article content
Attributable Production Cost of Sales per Equivalent Ounce Sold
Article content
Production cost of sales per equivalent ounce sold is defined as production cost of sales, as reported on the interim condensed consolidated statement of operations, divided by the total number of gold equivalent ounces sold. This measure converts the Company’s non-gold production into gold equivalent ounces and credits it to total production.
Article content
Attributable production cost of sales per equivalent ounce sold is a non-GAAP ratio and is defined as attributable production cost of sales divided by the attributable number of gold equivalent ounces sold. This measure converts the Company’s attributable non-gold production into gold equivalent ounces and credits it to total attributable production. Management uses this measure to monitor and evaluate the performance of its operating properties that are attributable to its shareholders.
Article content
The following table provides a reconciliation of production cost of sales and attributable production cost of sales per equivalent ounce sold for the periods presented:
Article content
| (expressed in millions of U.S. dollars, except ounces and production cost of sales per equivalent ounce) | Three months ended | Nine months ended | |||||||||||||
| September 30, | September 30, | ||||||||||||||
| 2025 | 2024 | 2025 | 2024 | ||||||||||||
| Production cost of sales – as reported | $ | 598.6 | $ | 564.3 | $ | 1,713.7 | $ | 1,613.3 | |||||||
| Less: non-controlling interest(b) production cost of sales | (21.3 | ) | (24.9 | ) | (64.5 | ) | (24.9 | ) | |||||||
| Attributable(a) production cost of sales | $ | 577.3 | $ | 539.4 | $ | 1,649.2 | $ | 1,588.4 | |||||||
| Gold equivalent ounces sold | 520,733 | 578,323 | 1,571,045 | 1,621,483 | |||||||||||
| Less: non-controlling interest(b) gold equivalent ounces sold | (16,622 | ) | (27,775 | ) | (52,070 | ) | (27,775 | ) | |||||||
| Attributable(a) gold equivalent ounces sold | 504,111 | 550,548 | 1,518,975 | 1,593,708 | |||||||||||
| Attributable(a) production cost of sales per equivalent ounce sold | $ | 1,145 | $ | 980 | $ | 1,086 | $ | 997 | |||||||
| Production cost of sales per equivalent ounce sold(e) | $ | 1,150 | $ | 976 | $ | 1,091 | $ | 995 | |||||||
Article content
See pages 21 and 22 for details of the footnotes referenced within the table above.
Article content
Attributable Production Cost of Sales per Ounce Sold on a By-Product Basis
Article content
Attributable production cost of sales per ounce sold on a by-product basis is a non-GAAP ratio which calculates the Company’s non-gold production as a credit against its per ounce production costs, rather than converting its non-gold production into gold equivalent ounces and crediting it to total production, as is the case in co-product accounting. Management believes that this ratio provides investors with the ability to better evaluate Kinross’ production cost of sales per ounce on a comparable basis with other major gold producers who routinely calculate their cost of sales per ounce using by-product accounting rather than co-product accounting.
Article content
The following table provides a reconciliation of attributable production cost of sales per ounce sold on a by-product basis for the periods presented:
Article content
| (expressed in millions of U.S. dollars, except ounces and production cost of sales per ounce) | Three months ended | Nine months ended | |||||||||||||
| September 30, | September 30, | ||||||||||||||
| 2025 | 2024 | 2025 | 2024 | ||||||||||||
| Production cost of sales – as reported | $ | 598.6 | $ | 564.3 | $ | 1,713.7 | $ | 1,613.3 | |||||||
| Less: non-controlling interest(b) production cost of sales | (21.3 | ) | (24.9 | ) | (64.5 | ) | (24.9 | ) | |||||||
| Less: attributable(a) silver revenue(c) | (31.7 | ) | (21.4 | ) | (75.8 | ) | (97.2 | ) | |||||||
| Attributable(a) production cost of sales net of silver by-product revenue | $ | 545.6 | $ | 518.0 | $ | 1,573.4 | $ | 1,491.2 | |||||||
| Gold ounces sold | 511,564 | 569,506 | 1,547,223 | 1,578,232 | |||||||||||
| Less: non-controlling interest(b) gold ounces sold | (16,428 | ) | (27,676 | ) | (51,575 | ) | (27,676 | ) | |||||||
| Attributable(a) gold ounces sold | 495,136 | 541,830 | 1,495,648 | 1,550,556 | |||||||||||
| Attributable(a) production cost of sales per ounce sold on a by-product basis | $ | 1,102 | $ | 956 | $ | 1,052 | $ | 962 | |||||||
| Production cost of sales per equivalent ounce sold(e) | $ | 1,150 | $ | 976 | $ | 1,091 | $ | 995 | |||||||
Article content
See pages 21 and 22 for details of the footnotes referenced within the table above.
Article content
Attributable All-In Sustaining Cost and All-In Cost per Ounce Sold on a By-Product Basis
Article content
Attributable all-in sustaining cost and all-in cost per ounce sold on a by-product basis are non-GAAP financial measures and ratios, as applicable, calculated based on guidance published by the World Gold Council (“WGC”). The WGC is a market development organization for the gold industry and is an association whose membership comprises leading gold mining companies including Kinross. Although the WGC is not a mining industry regulatory organization, it worked closely with its member companies to develop these metrics. Adoption of the all-in sustaining cost and all-in cost metrics is voluntary and not necessarily standard, and therefore, these measures and ratios presented by the Company may not be comparable to similar measures and ratios presented by other issuers. The Company believes that the all-in sustaining cost and all-in cost measures complement existing measures and ratios reported by Kinross.
Article content
All-in sustaining cost includes both operating and capital costs required to sustain gold production on an ongoing basis. The value of silver sold is deducted from the total production cost of sales as it is considered residual production, i.e. a by-product. Sustaining operating costs represent expenditures incurred at current operations that are considered necessary to maintain current production. Sustaining capital represents capital expenditures at existing operations comprising mine development costs, including capitalized development, and ongoing replacement of mine equipment and other capital facilities, and does not include capital expenditures for major growth projects or enhancement capital for significant infrastructure improvements at existing operations.
Article content
All-in cost is comprised of all-in sustaining cost as well as operating expenditures incurred at locations with no current operation, or costs related to other non-sustaining activities, and capital expenditures for major growth projects or enhancement capital for significant infrastructure improvements at existing operations.
Article content
Attributable all-in sustaining cost and all-in cost per ounce sold on a by-product basis are calculated by adjusting production cost of sales, as reported on the interim condensed consolidated statements of operations, as follows:
Article content
| (expressed in millions of U.S. dollars, except ounces and costs per ounce) | Three months ended | Nine months ended | |||||||||||||
| September 30, | September 30, | ||||||||||||||
| 2025 | 2024 | 2025 | 2024 | ||||||||||||
| Production cost of sales – as reported | $ | 598.6 | $ | 564.3 | $ | 1,713.7 | $ | 1,613.3 | |||||||
| Less: non-controlling interest(b)production cost of sales | (21.3 | ) | (24.9 | ) | (64.5 | ) | (24.9 | ) | |||||||
| Less: attributable(a)silver revenue(c) | (31.7 | ) | (21.4 | ) | (75.8 | ) | (97.2 | ) | |||||||
| Attributable(a)production cost of sales net of silver by-product revenue | $ | 545.6 | $ | 518.0 | $ | 1,573.4 | $ | 1,491.2 | |||||||
| Adjusting items on an attributable(a)basis: | |||||||||||||||
| General and administrative(f) | 31.2 | 27.2 | 96.5 | 90.3 | |||||||||||
| Other operating expense – sustaining(g) | 0.4 | 2.5 | 1.5 | 4.9 | |||||||||||
| Reclamation and remediation – sustaining(h) | 21.7 | 18.4 | 66.4 | 56.1 | |||||||||||
| Exploration and business development – sustaining(i) | 10.7 | 10.6 | 38.5 | 32.4 | |||||||||||
| Additions to property, plant and equipment – sustaining(j) | 174.7 | 141.8 | 406.6 | 367.6 | |||||||||||
| Lease payments – sustaining(k) | 1.8 | 3.2 | 4.4 | 9.9 | |||||||||||
| All-in Sustaining Cost on a by-product basis – attributable(a) | $ | 786.1 | $ | 721.7 | $ | 2,187.3 | $ | 2,052.4 | |||||||
| Adjusting items on an attributable(a)basis: | |||||||||||||||
| Other operating expense – non-sustaining(g) | 24.2 | 12.9 | 59.5 | 32.8 | |||||||||||
| Reclamation and remediation – non-sustaining(h) | 2.3 | 1.7 | 6.9 | 5.1 | |||||||||||
| Exploration and business development – non-sustaining(i) | 38.9 | 38.3 | 113.8 | 113.0 | |||||||||||
| Additions to property, plant and equipment – non-sustaining(j) | 132.9 | 133.7 | 406.9 | 404.5 | |||||||||||
| Lease payments – non-sustaining(k) | 0.2 | 0.1 | 0.6 | 0.2 | |||||||||||
| All-in Cost on a by-product basis – attributable(a) | $ | 984.6 | $ | 908.4 | $ | 2,775.0 | $ | 2,608.0 | |||||||
| Gold ounces sold | 511,564 | 569,506 | 1,547,223 | 1,578,232 | |||||||||||
| Less: non-controlling interest(b)gold ounces sold | (16,428 | ) | (27,676 | ) | (51,575 | ) | (27,676 | ) | |||||||
| Attributable(a)gold ounces sold | 495,136 | 541,830 | 1,495,648 | 1,550,556 | |||||||||||
| Attributable(a)all-in sustaining cost per ounce sold on a by-product basis | $ | 1,588 | $ | 1,332 | $ | 1,462 | $ | 1,324 | |||||||
| Attributable(a)all-in cost per ounce sold on a by-product basis | $ | 1,989 | $ | 1,677 | $ | 1,855 | $ | 1,682 | |||||||
| Production cost of sales per equivalent ounce sold(e) | $ | 1,150 | $ | 976 | $ | 1,091 | $ | 995 | |||||||
Article content
See pages 21 and 22 for details of the footnotes referenced within the table above.
Article content
Attributable All-In Sustaining Cost and All-In Cost per Equivalent Ounce Sold
Article content
The Company also assesses its attributable all-in sustaining cost and all-in cost on a gold equivalent ounce basis. Under these non-GAAP financial measures and ratios, the Company’s production of silver is converted into gold equivalent ounces and credited to total production.
Article content
Attributable all-in sustaining cost and all-in cost per equivalent ounce sold are calculated by adjusting production cost of sales, as reported on the interim condensed consolidated statements of operations, as follows:
Article content
| (expressed in millions of U.S. dollars, except ounces and costs per ounce) | Three months ended | Nine months ended | |||||||||||||
| September 30, | September 30, | ||||||||||||||
| 2025 | 2024 | 2025 | 2024 | ||||||||||||
| Production cost of sales – as reported | $ | 598.6 | $ | 564.3 | $ | 1,713.7 | $ | 1,613.3 | |||||||
| Less: non-controlling interest(b) production cost of sales | (21.3 | ) | (24.9 | ) | (64.5 | ) | (24.9 | ) | |||||||
| Attributable(a) production cost of sales | $ | 577.3 | $ | 539.4 | $ | 1,649.2 | $ | 1,588.4 | |||||||
| Adjusting items on an attributable(a)basis: | |||||||||||||||
| General and administrative(f) | 31.2 | 27.2 | 96.5 | 90.3 | |||||||||||
| Other operating expense – sustaining(g) | 0.4 | 2.5 | 1.5 | 4.9 | |||||||||||
| Reclamation and remediation – sustaining(h) | 21.7 | 18.4 | 66.4 | 56.1 | |||||||||||
| Exploration and business development – sustaining(i) | 10.7 | 10.6 | 38.5 | 32.4 | |||||||||||
| Additions to property, plant and equipment – sustaining(j) | 174.7 | 141.8 | 406.6 | 367.6 | |||||||||||
| Lease payments – sustaining(k) | 1.8 | 3.2 | 4.4 | 9.9 | |||||||||||
| All-in Sustaining Cost – attributable(a) | $ | 817.8 | $ | 743.1 | $ | 2,263.1 | $ | 2,149.6 | |||||||
| Adjusting items on an attributable(a)basis: | |||||||||||||||
| Other operating expense – non-sustaining(g) | 24.2 | 12.9 | 59.5 | 32.8 | |||||||||||
| Reclamation and remediation – non-sustaining(h) | 2.3 | 1.7 | 6.9 | 5.1 | |||||||||||
| Exploration and business development – non-sustaining(i) | 38.9 | 38.3 | 113.8 | 113.0 | |||||||||||
| Additions to property, plant and equipment – non-sustaining(j) | 132.9 | 133.7 | 406.9 | 404.5 | |||||||||||
| Lease payments – non-sustaining(k) | 0.2 | 0.1 | 0.6 | 0.2 | |||||||||||
| All-in Cost – attributable(a) | $ | 1,016.3 | $ | 929.8 | $ | 2,850.8 | $ | 2,705.2 | |||||||
| Gold equivalent ounces sold | 520,733 | 578,323 | 1,571,045 | 1,621,483 | |||||||||||
| Less: non-controlling interest(b)gold equivalent ounces sold | (16,622 | ) | (27,775 | ) | (52,070 | ) | (27,775 | ) | |||||||
| Attributable(a) gold equivalent ounces sold | 504,111 | 550,548 | 1,518,975 | 1,593,708 | |||||||||||
| Attributable(a) all-in sustaining cost per equivalent ounce sold | $ | 1,622 | $ | 1,350 | $ | 1,490 | $ | 1,349 | |||||||
| Attributable(a) all-in cost per equivalent ounce sold | $ | 2,016 | $ | 1,689 | $ | 1,877 | $ | 1,697 | |||||||
| Production cost of sales per equivalent ounce sold(e) | $ | 1,150 | $ | 976 | $ | 1,091 | $ | 995 | |||||||
Article content
See pages 21 and 22 for details of the footnotes referenced within the table above.
Article content
Capital Expenditures and Attributable Capital Expenditures
Article content
Capital expenditures are classified as either sustaining capital expenditures or non-sustaining capital expenditures, depending on the nature of the expenditure. Sustaining capital expenditures typically represent capital expenditures at existing operations including capitalized exploration costs and capitalized development unless related to major projects, ongoing replacement of mine equipment and other capital facilities and other capital expenditures and is calculated as total additions to property, plant and equipment (as reported on the interim condensed consolidated statements of cash flows), less non-sustaining capital expenditures. Non-sustaining capital expenditures represent capital expenditures for major projects, including major capital development projects at existing operations that are expected to materially benefit the operation, as well as enhancement capital for significant infrastructure improvements at existing operations. Management believes the distinction between sustaining capital expenditures and non-sustaining expenditures is a useful indicator of the purpose of capital expenditures and this distinction is an input into the calculation of attributable all-in sustaining costs per ounce and attributable all-in costs per ounce. The categorization of sustaining capital expenditures and non-sustaining capital expenditures is consistent with the definitions under the WGC all-in cost standard. Sustaining capital expenditures and non-sustaining capital expenditures are not defined under IFRS, however, the sum of these two measures total to additions to property, plant and equipment as disclosed under IFRS on the interim condensed consolidated statements of cash flows.
Article content
Additions to property, plant and equipment per the interim condensed consolidated statements of cash flows includes 100% of capital expenditures for Manh Choh. Attributable capital expenditures is a non-GAAP financial measure and includes Kinross’ 70% share of capital expenditures for Manh Choh. Management believes this to be a useful indicator of Kinross’ cash resources utilized for capital expenditures.
Article content
The following table provides a reconciliation of the classification of capital expenditures for the periods presented:
Article content
| (expressed in millions of U.S. dollars) | ||||||||||||||||||||||||
| Three months ended September 30, 2025 | Tasiast (Mauritania) | Paracatu (Brazil) | La Coipa (Chile) | Fort Knox(l) (USA) | Round Mountain (USA) | Bald Mountain (USA) | Total USA | Other | Total | |||||||||||||||
| Sustaining capital expenditures | $ | 47.6 | $ | 58.2 | $ | 18.5 | $ | 45.0 | $ | 4.5 | $ | 5.3 | $ | 54.8 | $ | 0.2 | $ | 179.3 | ||||||
| Non-sustaining capital expenditures | 54.4 | – | – | – | 28.5 | 22.6 | 51.1 | 27.4 | 132.9 | |||||||||||||||
| Additions to property, plant and equipment – per cash flow | $ | 102.0 | $ | 58.2 | $ | 18.5 | $ | 45.0 | $ | 33.0 | $ | 27.9 | $ | 105.9 | $ | 27.6 | $ | 312.2 | ||||||
| Less: Non-controlling interest(b) | $ | – | $ | – | $ | – | $ | (4.6 | ) | $ | – | $ | – | $ | (4.6 | ) | $ | – | $ | (4.6 | ) | |||
| Attributable(a)capital expenditures | $ | 102.0 | $ | 58.2 | $ | 18.5 | $ | 40.4 | $ | 33.0 | $ | 27.9 | $ | 101.3 | $ | 27.6 | $ | 307.6 | ||||||
| Three months ended September 30, 2024 | ||||||||||||||||||||||||
| Sustaining capital expenditures | $ | 13.5 | $ | 41.2 | $ | 21.3 | $ | 56.6 | $ | 5.2 | $ | 5.0 | $ | 66.8 | $ | 0.2 | $ | 143.0 | ||||||
| Non-sustaining capital expenditures | 70.3 | – | 3.6 | 13.8 | 30.7 | 1.1 | 45.6 | 16.2 | 135.7 | |||||||||||||||
| Additions to property, plant and equipment – per cash flow | $ | 83.8 | $ | 41.2 | $ | 24.9 | $ | 70.4 | $ | 35.9 | $ | 6.1 | $ | 112.4 | $ | 16.4 | $ | 278.7 | ||||||
| Less: Non-controlling interest(b) | $ | – | $ | – | $ | – | $ | (3.2 | ) | $ | – | $ | – | $ | (3.2 | ) | $ | – | $ | (3.2 | ) | |||
| Attributable(a)capital expenditures | $ | 83.8 | $ | 41.2 | $ | 24.9 | $ | 67.2 | $ | 35.9 | $ | 6.1 | $ | 109.2 | $ | 16.4 | $ | 275.5 | ||||||
| (expressed in millions of U.S. dollars) | ||||||||||||||||||||||||
| Nine months ended September 30, 2025 | Tasiast (Mauritania) | Paracatu (Brazil) | La Coipa (Chile) | Fort Knox(l) (USA) | Round Mountain (USA) | Bald Mountain (USA) | Total USA | Other | Total | |||||||||||||||
| Sustaining capital expenditures | $ | 84.4 | $ | 121.0 | $ | 59.1 | $ | 116.2 | $ | 13.0 | $ | 24.9 | $ | 154.1 | $ | 0.5 | $ | 419.1 | ||||||
| Non-sustaining capital expenditures | 187.4 | – | – | – | 82.4 | 61.2 | 143.6 | 75.9 | 406.9 | |||||||||||||||
| Additions to property, plant and equipment – per cash flow | $ | 271.8 | $ | 121.0 | $ | 59.1 | $ | 116.2 | $ | 95.4 | $ | 86.1 | $ | 297.7 | $ | 76.4 | $ | 826.0 | ||||||
| Less: Non-controlling interest(b) | $ | – | $ | – | $ | – | $ | (12.5 | ) | $ | – | $ | – | $ | (12.5 | ) | $ | – | $ | (12.5 | ) | |||
| Attributable(a)capital expenditures | $ | 271.8 | $ | 121.0 | $ | 59.1 | $ | 103.7 | $ | 95.4 | $ | 86.1 | $ | 285.2 | $ | 76.4 | $ | 813.5 | ||||||
| Nine months ended September 30, 2024 | ||||||||||||||||||||||||
| Sustaining capital expenditures | $ | 30.6 | $ | 105.4 | $ | 39.2 | $ | 141.9 | $ | 11.0 | $ | 41.8 | $ | 194.7 | $ | (1.0 | ) | $ | 368.9 | |||||
| Non-sustaining capital expenditures | 207.9 | – | 3.6 | 96.3 | 81.4 | 1.3 | 179.0 | 35.4 | 425.9 | |||||||||||||||
| Additions to property, plant and equipment – per cash flow | $ | 238.5 | $ | 105.4 | $ | 42.8 | $ | 238.2 | $ | 92.4 | $ | 43.1 | $ | 373.7 | $ | 34.4 | $ | 794.8 | ||||||
| Less: Non-controlling interest(b) | $ | – | $ | – | $ | – | $ | (22.7 | ) | $ | – | $ | – | $ | (22.7 | ) | $ | – | $ | (22.7 | ) | |||
| Attributable(a)capital expenditures | $ | 238.5 | $ | 105.4 | $ | 42.8 | $ | 215.5 | $ | 92.4 | $ | 43.1 | $ | 351.0 | $ | 34.4 | $ | 772.1 | ||||||
Article content
See pages 21 and 22 for details of the footnotes referenced within the tables above.
Article content
| (a) | “Attributable” measures and ratios include Kinross’ share of Manh Choh (70%) sales, costs, cash flows and capital expenditures. | |
| (b) | “Non-controlling interest” represents the non-controlling interest portion in Manh Choh (30%) and other subsidiaries for which the Company’s interest is less than 100% for cash flow from operating activities, costs, sales and capital expenditures, as appropriate. | |
| (c) | “Silver revenue” represents the portion of metal sales realized from the production of secondary or by-product metal (i.e. silver), which is produced as a by-product of the process used to produce gold and effectively reduces the cost of gold production. | |
| (d) | “Average realized gold price per ounce” is defined as gold revenue divided by total gold ounces sold. | |
| (e) | “Production cost of sales per equivalent ounce sold” is defined as production cost of sales divided by total gold equivalent ounces sold. | |
| (f) | “General and administrative” expenses are as reported on the interim condensed consolidated statements of operations, excluding certain impacts which the Company believes are not reflective of the Company’s underlying performance for the reporting period. General and administrative expenses are considered sustaining costs as they are required to be absorbed on a continuing basis for the effective operation and governance of the Company. | |
| (g) | “Other operating expense – sustaining” is calculated as “Other operating expense” as reported on the interim condensed consolidated statements of operations, less the non-controlling interest portion in Manh Choh (30%) and other subsidiaries for which the Company’s interest is less than 100% and other operating and reclamation and remediation expenses related to non-sustaining activities as well as other items not reflective of the underlying operating performance of the Company. Other operating expenses are classified as either sustaining or non-sustaining based on the type and location of the expenditure incurred. The majority of other operating expenses that are incurred at existing operations are considered costs necessary to sustain operations, and are therefore, classified as sustaining. Other operating expenses incurred at locations where there is no current operation or related to other non-sustaining activities are classified as non-sustaining. | |
| (h) | “Reclamation and remediation – sustaining” is calculated as current period accretion related to reclamation and remediation obligations plus current period amortization of the corresponding reclamation and remediation assets, less the non-controlling interest portion in Manh Choh (30%) and other subsidiaries for which the Company’s interest is less than 100%, and is intended to reflect the periodic cost of reclamation and remediation for currently operating mines. Reclamation and remediation costs for development projects or closed mines are excluded from this amount and classified as non-sustaining. | |
| (i) | “Exploration and business development – sustaining” is calculated as “Exploration and business development” expenses as reported on the interim condensed consolidated statements of operations, less the non-controlling interest portion in Manh Choh (30%) and other subsidiaries for which the Company’s interest is less than 100% and non-sustaining exploration and business development expenses. Exploration expenses are classified as either sustaining or non-sustaining based on a determination of the type and location of the exploration expenditure. Exploration expenditures within the footprint of operating mines are considered costs required to sustain current operations and are therefore included in sustaining costs. Exploration expenditures focused on new ore bodies near existing mines (i.e. brownfield), new exploration projects (i.e. greenfield) or for other generative exploration activity not linked to existing mining operations are classified as non-sustaining. Business development expenses are classified as either sustaining or non-sustaining based on a determination of the type of expense and requirement for general or growth-related operations. | |
| (j) | “Additions to property, plant and equipment – sustaining” and “non-sustaining” are as presented on pages 20 and 21 of this news release and include Kinross’ share of Manh Choh’s (70%) sustaining and non-sustaining capital expenditures. | |
| (k) | “Lease payments – sustaining” represents the majority of lease payments as reported on the interim condensed consolidated statements of cash flows and is made up of the principal and financing components of such cash payments, less the non-controlling interest portion in Manh Choh (30%) and other subsidiaries for which the Company’s interest is less than 100%, and non-sustaining lease payments. Lease payments for development projects or closed mines are classified as non-sustaining. | |
| (l) | The Fort Knox segment is composed of Fort Knox and Manh Choh for all periods presented. | |
Article content
Appendix A
Article content
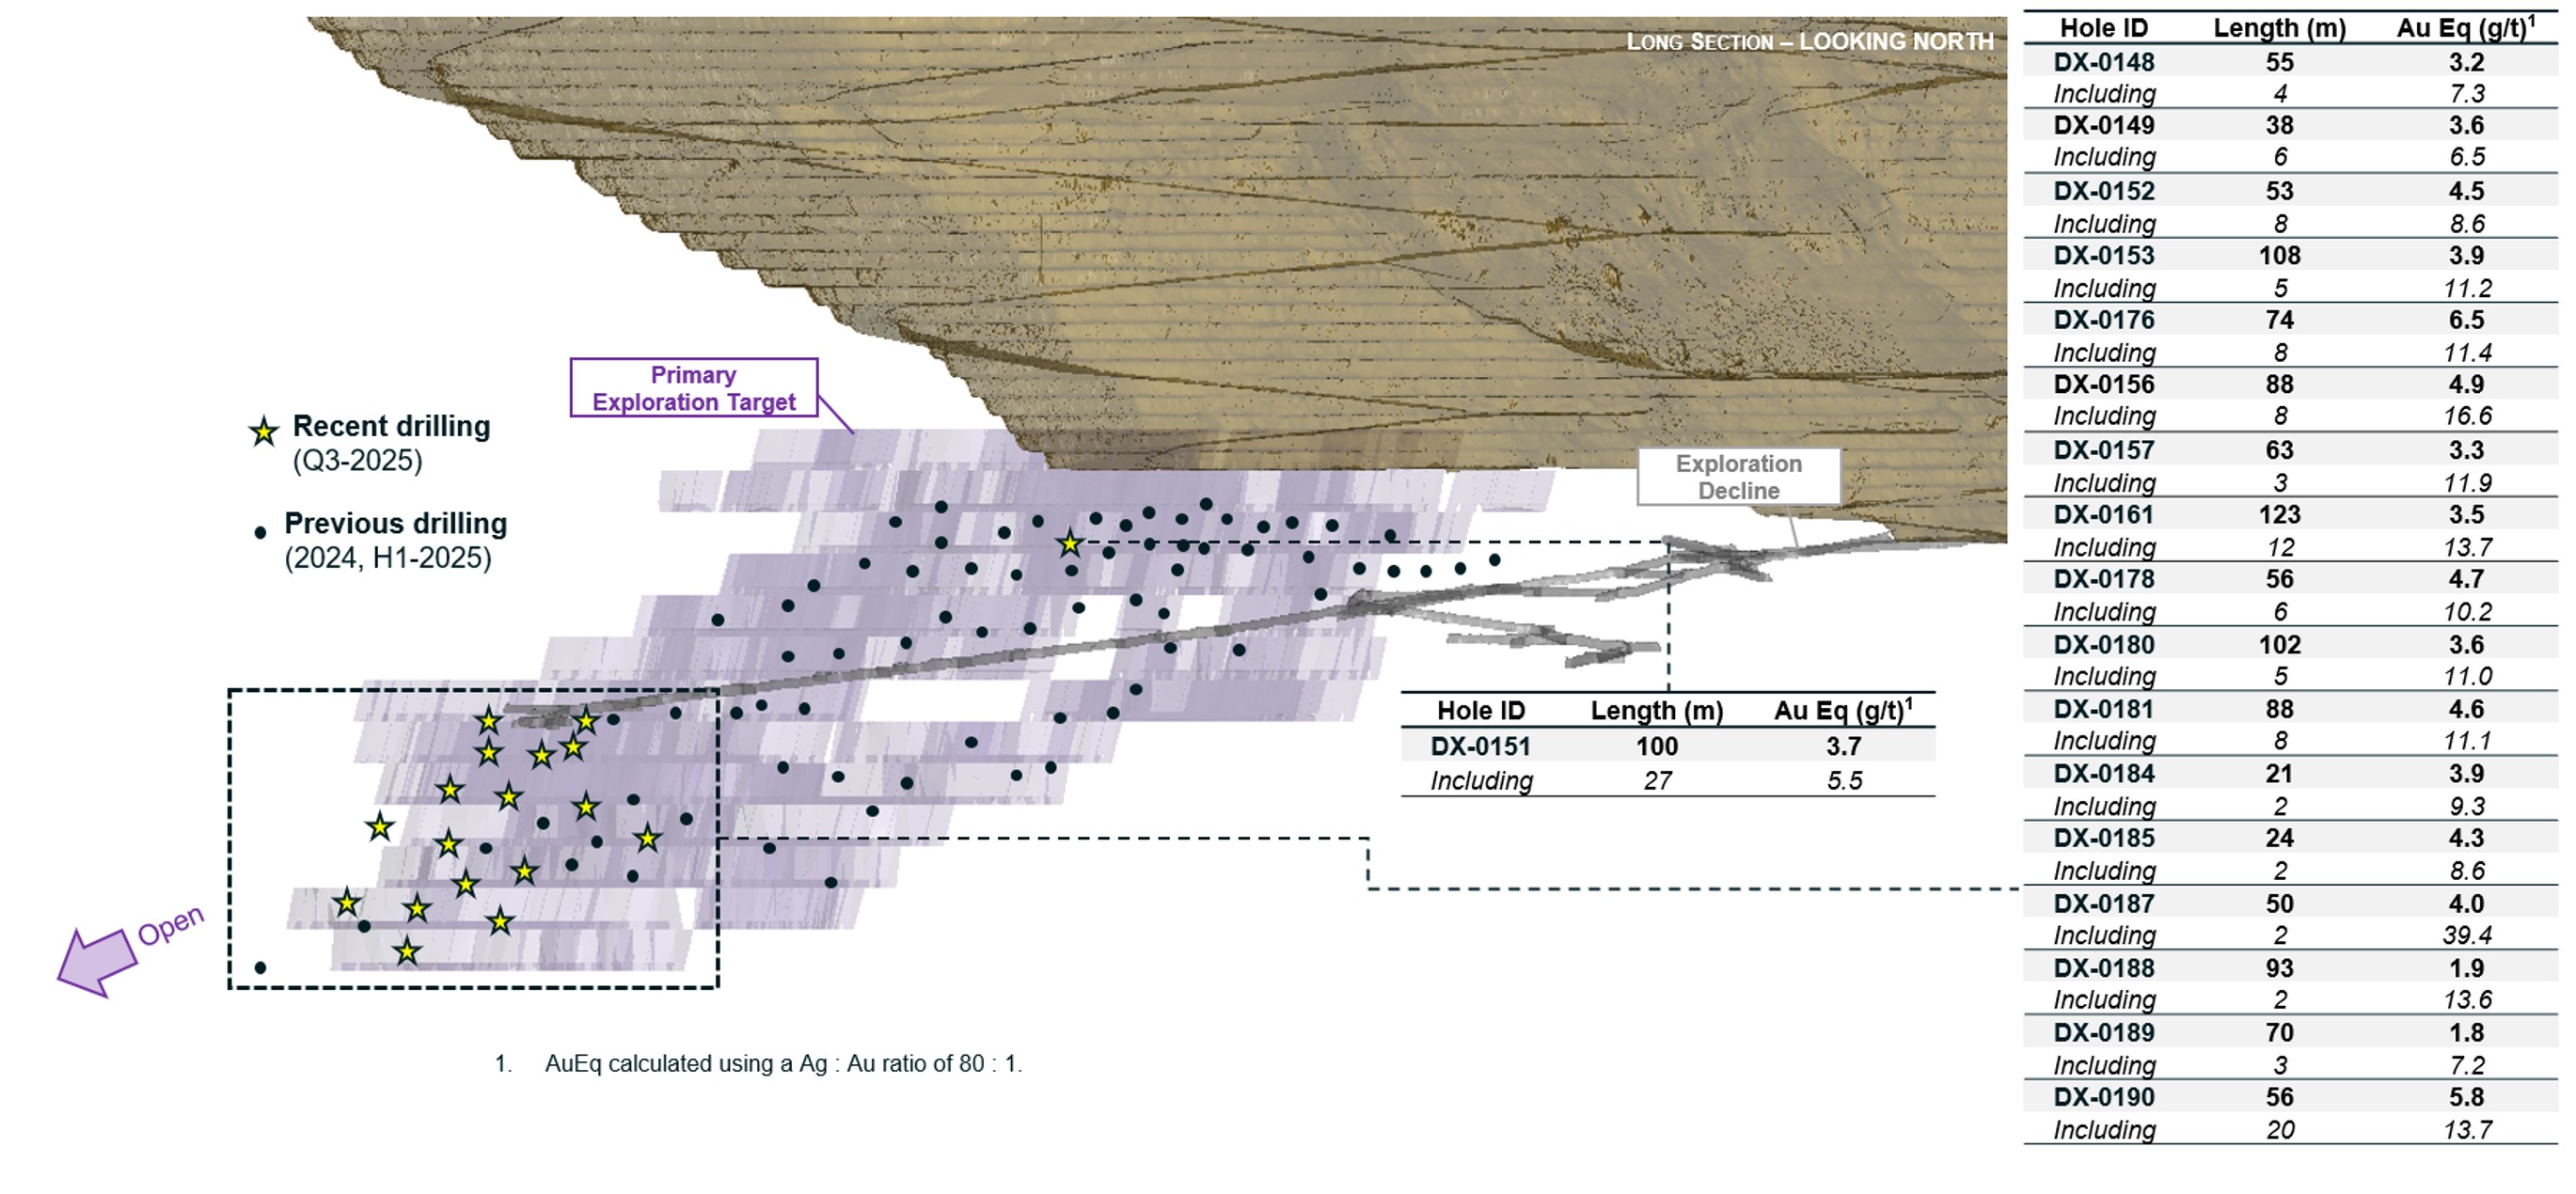
Figure 1: Extensive infill drilling has established strong coverage across both the upper and lower target zones, and extension drilling continues to indicate continuation of mineralization down dip outside of the original exploration target.
Article content
Article content
Article content
Cautionary statement on forward-looking information
Article content
All statements, other than statements of historical fact, contained or incorporated by reference in this news release including, but not limited to, any information as to the future financial or operating performance of Kinross, constitute “forward-looking information” or “forward-looking statements” within the meaning of certain securities laws, including the provisions of the Securities Act (Ontario) and the provisions for “safe harbor” under the United States Private Securities Litigation Reform Act of 1995 and are based on expectations, estimates and projections as of the date of this news release. Forward-looking statements contained in this news release, include, but are not limited to, those under the headings (or headings that include) “2025 third-quarter highlights”, “Return of Capital to shareholders”, “Operations highlights”, “Development and exploration projects”, “CEO commentary” and “Company Guidance”, as well as statements with respect to our guidance for production, cost guidance, including production costs of sales, all-in sustaining cost of sales, and capital expenditures; anticipated returns of capital to shareholders, including the declaration, payment and sustainability of the Company’s dividends; the size, scope and execution of the proposed share buybacks and the anticipated timing thereof, including the Company’s statement targeting share buybacks for 2025 of at least $600 million; identification of additional resources and reserves or the conversion of resources to reserves; the Company’s liquidity; the Company’s debt levels; the schedules budgets, and forecast economics for the Company’s development projects; budgets for and future plans for exploration, development and operation at the Company’s operations and projects, including the Great Bear project; planned timing for the submission of impact statements; potential mine life extensions at the Company’s operations; the Company’s balance sheet and liquidity outlook, as well as references to other possible events including, the future price of gold and silver, costs of production, operating costs; price inflation; capital expenditures, costs and timing of the development of projects and new deposits, estimates and the realization of such estimates (such as mineral or gold reserves and resources or mine life), success of exploration, development and mining, currency fluctuations, capital requirements, project studies, government regulation, permit applications, environmental risks and proceedings, and resolution of pending litigation. The words “advance”, “aim”, “continue”, “expects”, “focus”, “goal”, “guidance”, “on plan”, “on schedule”, “on track”, “opportunity”, “plan”, “potential”, “priority”, “progress”, “target”, “upside”, or variations of or similar such words and phrases or statements that certain actions, events or results may, could, should or will be achieved, received or taken, or will occur or result and similar such expressions identify forward-looking statements. Forward-looking statements are necessarily based upon a number of estimates and assumptions that, while considered reasonable by Kinross as of the date of such statements, are inherently subject to significant business, economic and competitive uncertainties and contingencies. The estimates, models and assumptions of Kinross referenced, contained or incorporated by reference in this news release, which may prove to be incorrect, include, but are not limited to, the various assumptions set forth herein and in our Management’s Discussion and Analysis (“MD&A”) for the year ended December 31, 2024, and the Annual Information Form dated March 27, 2025 as well as: (1) there being no significant disruptions affecting the operations of the Company, whether due to extreme weather events and other or related natural disasters, labour disruptions (including but not limited to strikes or workforce reductions), supply disruptions, power disruptions, damage to equipment, pit wall slides or otherwise; (2) permitting, development, operations and production from the Company’s operations and development projects being consistent with Kinross’ current expectations including, without limitation: the maintenance of existing permits and approvals and the timely receipt of all permits and authorizations necessary for construction and operations; water and power supply and continued operation of the tailings reprocessing facility at Paracatu; permitting of the Great Bear project (including the consultation process with Indigenous groups), permitting and development of the Lobo-Marte project; in each case in a manner consistent with the Company’s expectations; and the successful completion of exploration consistent with the Company’s expectations at the Company’s projects; (3) political regulatory and legal developments in any jurisdiction in which the Company operates being consistent with its current expectations including, without limitation, restrictions or penalties imposed, or actions taken, by any government, including but not limited to amendments to the mining laws and tailings facility regulations in Brazil (including those related to financial assurance requirements), potential amendments to water laws and/or other water use restrictions and regulatory actions in Chile, dam safety regulations, potential amendments to minerals and mining laws and energy levies laws, new regulations relating to work permits, potential amendments to customs and mining laws (including but not limited to amendments to the VAT) and the potential application of the tax code in Mauritania, potential amendments to and enforcement of tax laws in Mauritania (including, but not limited to, the interpretation, implementation, application and enforcement of any such laws and amendments thereto), substantial changes to the federal and/or provincial regulatory and permitting regimes in Canada, potential third party legal challenges to existing permits, and the impact of any trade tariffs being consistent with Kinross’ current expectations; (4) the completion of studies and the results of those studies being consistent with Kinross’ current expectations; (5) the exchange rate between the Canadian dollar, Brazilian real, Chilean peso, Mauritanian ouguiya and the U.S. dollar being approximately consistent with current levels; (6) certain price assumptions for gold and silver which includes, as it relates to share repurchases, assumptions that prices for gold and silver remain approximately consistent with current levels; (7) prices for diesel, natural gas, fuel oil, electricity and other key supplies being approximately consistent with the Company’s expectations; (8) attributable production and cost of sales forecasts for the Company meeting expectations; (9) the accuracy of the current mineral reserve and mineral resource estimates of the Company and Kinross’ analysis thereof being consistent with expectations (including but not limited to ore tonnage and ore grade estimates), future mineral resource and mineral reserve estimates being consistent with preliminary work undertaken by the Company, mine plans for the Company’s current and future mining operations, and the Company’s internal models; (10) labour and materials costs increasing on a basis consistent with Kinross’ current expectations; (11) the terms and conditions of the legal and fiscal stability agreements for Tasiast being interpreted and applied in a manner consistent with their intent and Kinross’ expectations and without material amendment or formal dispute (including without limitation the application of tax, customs and duties exemptions and royalties); (12) asset impairment potential; (13) the regulatory and legislative regime regarding mining, electricity production and transmission (including rules related to power tariffs) in Brazil being consistent with Kinross’ current expectations; (14) access to capital markets, including but not limited to maintaining our current credit ratings consistent with the Company’s current expectations; (15) potential direct or indirect operational impacts resulting from infectious diseases or pandemics; (16) changes in national and local government legislation or other government actions, including the Canadian federal impact assessment regime; (17) litigation, regulatory proceedings and audits, and the potential ramifications thereof, being concluded in a manner consistent with the Company’s expectations (including without limitation litigation in Chile relating to the alleged damage of wetlands and the scope of any remediation plan or other environmental obligations arising therefrom); (18) the Company’s financial results, cash flows and future prospects being consistent with Company expectations in amounts sufficient to permit sustained dividend payments; (19) the impacts of potential geotechnical instability being consistent with the Company’s expectations; and (20) the impacts of groundwater inflows at the La Coipa pit being consistent with the Company’s expectations. Known and unknown factors could cause actual results to differ materially from those projected in the forward-looking statements. Such factors include, but are not limited to: the inaccuracy of any of the foregoing assumptions; fluctuations in the currency markets; fluctuations in the spot and forward price of gold or certain other commodities (such as fuel and electricity); price inflation of goods and services; changes in the discount rates applied to calculate the present value of net future cash flows based on country-specific real weighted average cost of capital; changes in the market valuations of peer group gold producers and the Company, and the resulting impact on market price to net asset value multiples; changes in various market variables, such as interest rates, foreign exchange rates, gold or silver prices and lease rates, or global fuel prices, that could impact the mark-to-market value of outstanding derivative instruments and ongoing payments/receipts under any financial obligations; risks arising from holding derivative instruments (such as credit risk, market liquidity risk and mark-to-market risk); changes in national and local government legislation, taxation (including but not limited to income tax, advance income tax, stamp tax, withholding tax, capital tax, tariffs, value-added or sales tax, capital outflow tax, capital gains tax, windfall or windfall profits tax, production royalties, excise tax, customs/import or export taxes/duties, asset taxes, asset transfer tax, property use or other real estate tax, together with any related fine, penalty, surcharge, or interest imposed in connection with such taxes), controls, tariffs, policies and regulations; the security of personnel and assets; political or economic developments in Canada, the United States, Chile, Brazil, Mauritania or other countries in which Kinross does business or may carry on business; business opportunities that may be presented to, or pursued by, us; our ability to successfully integrate acquisitions and complete divestitures; operating or technical difficulties in connection with mining, development or refining activities; employee relations; litigation or other claims against, or regulatory investigations and/or any enforcement actions, administrative orders or sanctions in respect of the Company (and/or its directors, officers, or employees) including, but not limited to, securities class action litigation in Canada and/or the United States, environmental litigation or regulatory proceedings or any investigations, enforcement actions and/or sanctions under any applicable anti-corruption, international sanctions and/or anti-money laundering laws and regulations in Canada, the United States or any other applicable jurisdiction; the speculative nature of gold exploration and development including, but not limited to, the risks of obtaining and maintaining necessary licenses and permits; diminishing quantities or grades of reserves; adverse changes in our credit ratings; and contests over title to properties, particularly title to undeveloped properties. In addition, there are risks and hazards associated with the business of gold exploration, development and mining, including environmental hazards, industrial accidents, unusual or unexpected formations, pressures, cave-ins, flooding and gold bullion losses (and the risk of inadequate insurance, or the inability to obtain insurance, to cover these risks). Many of these uncertainties and contingencies can directly or indirectly affect, and could cause, Kinross’ actual results to differ materially from those expressed or implied in any forward-looking statements made by, or on behalf of, Kinross, including but not limited to resulting in an impairment charge on goodwill and/or assets. There can be no assurance that forward-looking statements will prove to be accurate, as actual results and future events could differ materially from those anticipated in such statements. Forward-looking statements are provided for the purpose of providing information about management’s expectations and plans relating to the future. All of the forward-looking statements made in this news release are qualified by this cautionary statement and those made in our other filings with the securities regulators of Canada and the United States including, but not limited to, the cautionary statements made in the “Risk Analysis” section of our MD&A for the year ended December 31, 2024, and the “Risk Factors” set forth in the Company’s Annual Information Form dated March 27, 2025. These factors are not intended to represent a complete list of the factors that could affect Kinross. Kinross disclaims any intention or obligation to update or revise any forward-looking statements or to explain any material difference between subsequent actual events and such forward-looking statements, except to the extent required by applicable law.
Article content
Key Sensitivities
Article content
Approximately 70%-80% of the Company’s costs are denominated in U.S. dollars.
Article content
A 10% change in foreign currency exchange rates would be expected to result in an approximate $25 impact on attributable production cost of sales per equivalent ounce sold1,
12.
Article content
Specific to the Brazilian real, a 10% change in the exchange rate would be expected to result in an approximate $45 impact on Brazilian attributable production cost of sales per equivalent ounce sold1.
Article content
Specific to the Chilean peso, a 10% change in the exchange rate would be expected to result in an approximate $50 impact on Chilean attributable production cost of sales per equivalent ounce sold1.
Article content
A $10 per barrel change in the price of oil would be expected to result in an approximate $3 impact on attributable production cost of sales per equivalent ounce sold1.
Article content
A $100 change in the price of gold would be expected to result in an approximate $5 impact on attributable production cost of sales per equivalent ounce sold1 as a result of a change in royalties.
Article content
Other information
Article content
Where we say “we”, “us”, “our”, the “Company”, or “Kinross” in this news release, we mean Kinross Gold Corporation and/or one or more or all of its subsidiaries, as may be applicable.
Article content
The technical information about the Company’s mineral properties contained in this news release has been prepared under the supervision of Mr. Nicos Pfeiffer, an officer of the Company who is a “qualified person” within the meaning of National Instrument 43-101.
Article content
Source: Kinross Gold Corporation
Article content
____________________________________
1 Unless otherwise stated, production figures in this news release are on an attributable basis. “Attributable” includes Kinross’ 70% share of Manh Choh production, costs, cash flows and capital expenditures. Financial figures include 100% of Manh Choh results except when denoted as attributable. Attributable figures are non-GAAP financial measures and ratios. Refer to footnote 6.
2 “Production cost of sales per equivalent ounce sold” is defined as production cost of sales, as reported on the interim condensed consolidated statements of operations, divided by total gold equivalent ounces sold.
3 Operating cash flow figures in this release represent “Net cash flow provided from operating activities,” as reported on the interim condensed consolidated statements of cash flows.
4 “Margins” per equivalent ounce sold is defined as average realized gold price per ounce less production cost of sales per equivalent ounce sold.
5 Earnings, net earnings, and reported net earnings figures in this news release represent “Net earnings attributable to common shareholders,” as reported on the interim condensed consolidated statements of operations.
6 These figures are non-GAAP financial measures and ratios, as applicable, and are defined and reconciled on pages 16 to 22 of this news release. Non-GAAP financial measures and ratios have no standardized meaning under International Financial Reporting Standards (“IFRS”) and therefore, may not be comparable to similar measures presented by other issuers.
7 Net cash is calculated as cash and cash equivalents of $1,721.7 million less long-term debt of $1,236.9 million as reported on the Company’s interim condensed consolidated balance sheet as at September 30, 2025.
Article content
8 “Total liquidity” is defined as the sum of cash and cash equivalents, as reported on the interim condensed consolidated balance sheets, and available credit under the Company’s credit facilities (as calculated in Section 6 Liquidity and Capital Resources of Kinross’ MD&A for the three and nine months ended September 30, 2025).
9 “Average realized gold price per ounce” is defined as gold revenue divided by total gold ounces sold.
10 “Capital expenditures” is “Additions to property, plant and equipment” on the interim condensed consolidated statements of cash flows.
11 “Available credit” is defined as available credit under the Company’s credit facilities and is calculated in Section 6 Liquidity and Capital Resources of Kinross’ MD&A for the three and nine months ended September 30, 2025.
12 Refers to all of the currencies in the countries where the Company has mining operations, fluctuating simultaneously by 10% in the same direction, either appreciating or depreciating, taking into consideration the impact of hedging and the weighting of each currency within our consolidated cost structure.
Article content
For more information,
please see Kinross’ 2025 Q3
Financial Statements and MD&A
at www.kinross.com
Article content
Article content
Article content
Article content

Article content
Article content
 English (US)