
.jpg) 18 hours ago
1
18 hours ago
1
Jul 30, 2025, 08:05:59 AM IST

In the Nifty500 pack, six stocks' close prices crossed above their 200 DMA (Daily Moving Averages) on July 29, according to stockedge.com's technical scan data. The 200-day DMA is used as a key indicator by traders for determining the overall trend in a particular stock. As long as the stock is priced above the 200-day SMA on the daily time frame, it is generally considered to be an overall uptrend. Take a look:
TIMESOFINDIA.COM
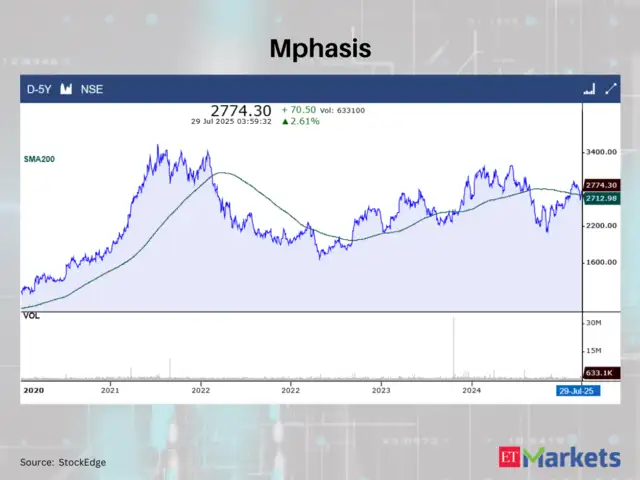
200 DMA: Rs 2,712.98| LTP: Rs 2,774.3
ETMarkets.com
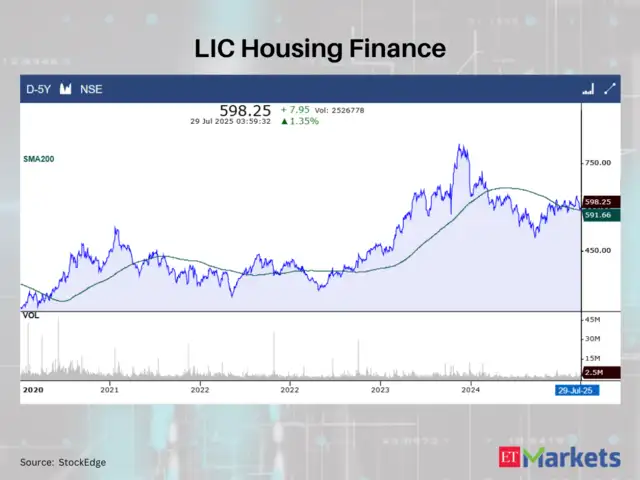
200 DMA: Rs 591.66| LTP: Rs 598.25
ETMarkets.com
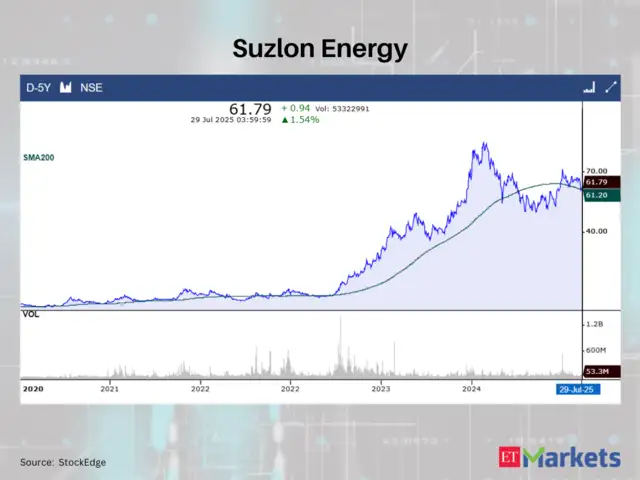
200 DMA: Rs 61.2| LTP: Rs 61.79
ETMarkets.com
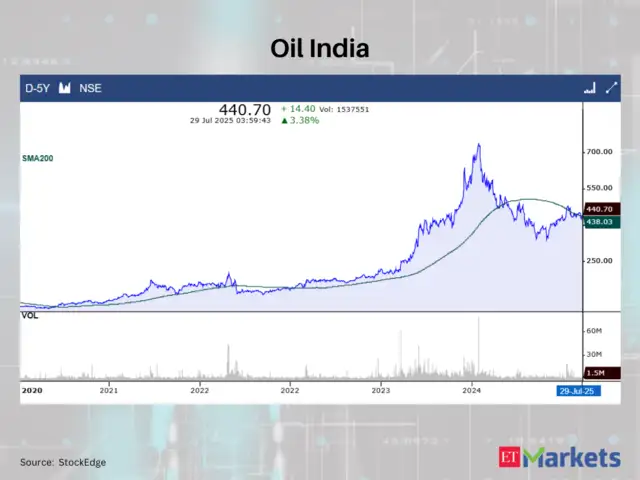
200 DMA: Rs 438.03| LTP: Rs 440.7
ETMarkets.com
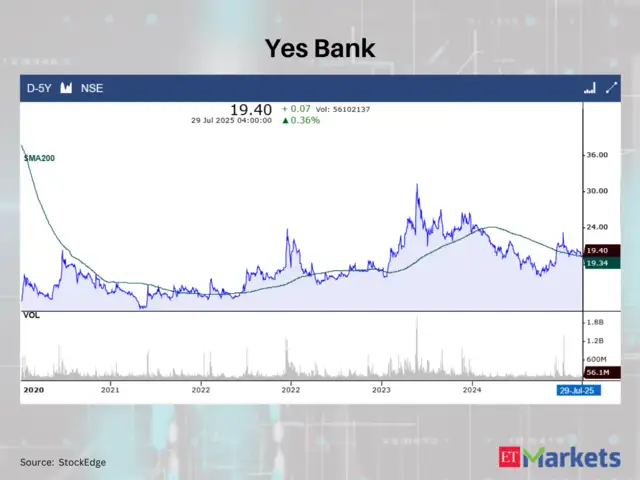
200 DMA: Rs 19.34| LTP: Rs 19.4
ETMarkets.com
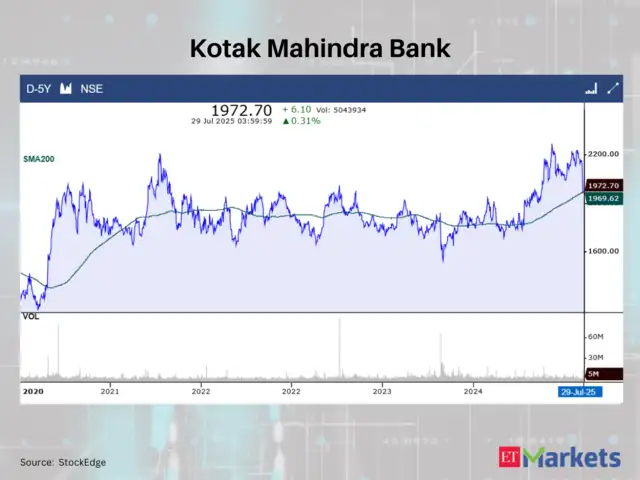
200 DMA: Rs 1,969.62| LTP: Rs 1,972.7
ETMarkets.com
 English (US)