
.jpg) 1 hour ago
2
1 hour ago
2

Article content
DENVER — Newmont Corporation (NYSE: NEM, ASX: NGT, PNGX: NEM) (Newmont or the Company) reported gold Mineral Reserves (“reserves”) of 118.2 million attributable ounces at the end of 2025 compared to 134.1 million attributable ounces at the end of 2024, mainly driven by the divestment of assets in 2025. Newmont’s portfolio includes significant reserves from other metals, including 12.5 million attributable tonnes of copper reserves and 442 million attributable ounces of silver reserves.
![]()
THIS CONTENT IS RESERVED FOR SUBSCRIBERS ONLY
Subscribe now to read the latest news in your city and across Canada.
- Exclusive articles from Barbara Shecter, Joe O'Connor, Gabriel Friedman, and others.
- Daily content from Financial Times, the world's leading global business publication.
- Unlimited online access to read articles from Financial Post, National Post and 15 news sites across Canada with one account.
- National Post ePaper, an electronic replica of the print edition to view on any device, share and comment on.
- Daily puzzles, including the New York Times Crossword.
SUBSCRIBE TO UNLOCK MORE ARTICLES
Subscribe now to read the latest news in your city and across Canada.
- Exclusive articles from Barbara Shecter, Joe O'Connor, Gabriel Friedman and others.
- Daily content from Financial Times, the world's leading global business publication.
- Unlimited online access to read articles from Financial Post, National Post and 15 news sites across Canada with one account.
- National Post ePaper, an electronic replica of the print edition to view on any device, share and comment on.
- Daily puzzles, including the New York Times Crossword.
REGISTER / SIGN IN TO UNLOCK MORE ARTICLES
Create an account or sign in to continue with your reading experience.
- Access articles from across Canada with one account.
- Share your thoughts and join the conversation in the comments.
- Enjoy additional articles per month.
- Get email updates from your favourite authors.
THIS ARTICLE IS FREE TO READ REGISTER TO UNLOCK.
Create an account or sign in to continue with your reading experience.
- Access articles from across Canada with one account
- Share your thoughts and join the conversation in the comments
- Enjoy additional articles per month
- Get email updates from your favourite authors
Sign In or Create an Account
or
Article content
Article content
“In 2025, Newmont maintained its position of having the industry’s largest gold reserve base, declaring 118 million ounces of reserves, representing decades of production life with meaningful upside,” said Natascha Viljoen, Newmont’s President and Chief Executive Officer. “Through the disciplined application of technical rigor in our leading exploration program, we remain focused on extending mine life, discovering new opportunities, and unlocking value across our world-class portfolio of operations and projects.”
Article content
Article content
By signing up you consent to receive the above newsletter from Postmedia Network Inc.
Article content
2025 Reserves & Resources Highlights
Article content
- The gold industry’s largest reserve base with 118.2 million attributable ounces1
- Changes since 2024 are mainly driven by divestments (8.6 million ounces), followed by depletion from mining, reclassification of the Yanacocha Sulfides project reserves to resources, and cost escalation assumptions, offset by an increased gold price assumption, resource conversion and other positive revisions at Brucejack, Tanami, Lihir, Ahafo North and Ahafo South
- Gold reserves are determined based on a gold price of $2,000 per ounce following the annual pricing review, more than 20 percent below the three-year trailing average price and well below the current spot price
- Newmont benefits from a premier operating asset base with gold reserve life of ten years or more at Lihir, Cadia, Tanami, Boddington, Ahafo North, Merian, Cerro Negro, Brucejack, Nevada Gold Mines (NGM), and Pueblo Viejo further enhanced by a broader portfolio and organic project pipeline
- Measured & Indicated Gold Mineral Resources2 of 88.1 million attributable ounces and Inferred Resources of 60.6 million attributable ounces, determined based on a gold price of $2,300 per ounce
- Significant exposure to other metals including 12.5 million attributable tonnes of copper reserves, 13.1 million attributable tonnes of Measured & Indicated copper resources and 5.6 million attributable tonnes of Inferred copper resources, along with 442 million ounces of silver reserves, 508 million ounces of Measured & Indicated silver resources and 126 million ounces of Inferred silver resources
- Additional exposure to other metals including lead, zinc and molybdenum
Article content
| _______________________________________________ | ||
1 | Compared to 2024 reserves disclosed by gold mining companies in 2025 | |
2 | Exclusive of Mineral Reserves | |
Article content
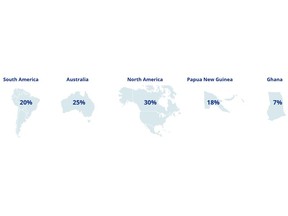
Percentage of Gold Reserves by Jurisdiction
Article content
Article content
Newmont’s reserve base is a key differentiator with an operating reserve life of more than ten years at eight managed sites and two non-managed joint ventures, anchored in favorable mining jurisdictions along with significant upside potential from a robust organic project pipeline.
Article content
PROVEN & PROBABLE GOLD RESERVES
Article content
For 2025, Newmont reported 118.2 million attributable ounces of gold reserves compared to the prior year total of 134.1 million attributable ounces. Divestment of assets accounted for 8.6 million ounces of this reduction3, followed by depletion from mining of 7.2 million ounces, net negative revisions of 5.6 million ounces (primarily from Yanacocha Sulfides reclassified to resource) and cost escalation assumption impacts of 3.1 million ounces, offset by increases from price related revisions of 6.6 million ounces, as well as the addition of 2.0 million ounces from conversion of resources and other additions primarily at Brucejack (+0.7 million ounces) and Lihir (+0.5 million ounces).
Article content
| _____________________________________________ | ||
3 | Assets divested in 2025 were CC&V, United States; Musselwhite, Canada; Porcupine, Canada; Éléonore, Canada; and Akyem, Ghana. | |
Article content
Managed Assets
Article content
- Brucejack reserves increased 1.0 million ounces to 2.9 million ounces, primarily due to conversion of resources of 0.7 million, positive net revisions of 0.3 million following favorable drilling results and a favorable price impact of 0.2 million ounces net of cost escalation assumptions, offsetting depletion of 0.2 million ounces
- Merian reserves increased 0.4 million ounces to 4.5 million ounces, primarily due to favorable price related revisions of 0.8 million ounces, more than offsetting negative net revisions of 0.2 million ounces and depletion of 0.2 million ounces
- Lihir reserves increased 0.2 million ounces to 16.0 million ounces, primarily due to favorable price impacts of 0.8 million ounces and conversion from resources through infill drilling of 0.5 million ounces, partially offset by net negative revisions of 0.3 million ounces offsetting depletion of 0.8 million ounces
- Tanami reserves increased 0.2 million ounces to 5.3 million ounces, primarily due to favorable price impacts, net of cost escalation of 0.3 million ounces, additions from net positive revisions of 0.2 million ounces and resource conversion from infill drilling of 0.1 million ounces, more than offsetting depletion of 0.4 million ounces
- Ahafo North reserves increased 0.1 million ounces to 4.7 million ounces, primarily due to additions from resources through updated mine designs of 0.2 million ounces, partially offset by depletion of 0.1 million ounces
- Red Chris reserves decreased 0.1 million ounces to 3.6 million ounces, primarily due to depletion of 0.1 million ounces
- Cerro Negro reserves decreased 0.2 million ounces to 3.0 million ounces, primarily due to depletion of 0.2 million ounces and negative net revisions of 0.1 million ounces, partially offset by 0.1 million ounces of conversions from resources with infill drilling
- Ahafo South reserves decreased 0.5 million ounces to 4.1 million ounces, primarily due to the depletion of 0.8 million ounces, partially offset by 0.2 million ounces added at the Apensu South open pit and positive price impacts of 0.1 million ounces
- Boddington reserves decreased 0.6 million ounces to 10.2 million ounces, primarily due to depletion of 0.6 million ounces and negative net revisions of 0.1 million ounces, partially offset by favorable price related revisions 0.1 million ounces net of cost escalation assumptions
- Cadia reserves decreased 0.6 million ounces to 13.5 million ounces, primarily due to depletion of 0.5 million ounces
- Peñasquito reserves decreased 0.9 million ounces to 3.2 million ounces, primarily due to depletion of 0.8 million ounces along with negative net revisions from a block model update of 0.2 million ounces partially offset by favorable price impact of 0.1 million ounces
- Yanacocha reserves decreased 4.8 million ounces to 0.5 million ounces, primarily due to the reclassification of 4.5 million ounces of reserves relating to the Yanacocha Sulfides project to resources, allowing Newmont to prioritize other opportunities at site and continue advancing closure activities in non-operating areas
Advertisement 1
Advertisement 2
Article content
Non-Managed Assets
Article content
- Newmont’s 38.5 percent interest in Nevada Gold Mines represented 17.4 million attributable ounces of gold reserves at year end, compared to 17.9 million ounces at the end of 2024
- Newmont’s 40 percent interest in Pueblo Viejo represented 8.2 million attributable ounces of gold reserves at year end with no change from 2024
Article content
Newmont’s gold grade reserve remained unchanged at 0.94 grams per tonne year over year when adjusted for the divested assets.
Article content
GOLD RESOURCES45
Article content
At the end of 2025, Newmont reported Measured and Indicated Gold Mineral Resources of 88.1 million attributable ounces, an 11 percent decrease from the prior year total of 99.4 million attributable ounces. Inferred Gold Mineral Resources totaled 60.6 million attributable ounces, a 14 percent decrease from the prior year total of 70.6 million attributable ounces. The main driver of lower resources is 14.6 million ounces removed from assets divested in 20256, together with net negative revisions, net resource conversions to reserves, and updated cost assumptions; partially offset by the resource increases from price assumption related revisions, as well as additions.
Article content
Notable Changes7
Article content
- Cadia resources decreased by 8.5 million ounces (44 percent) to 11.0 million ounces, primarily driven by 5.7 million ounces of net negative revisions related to a geotechnical standoff from the in-pit tailings facility as well as block model updates and changes to inferred resource classifications as a consequence of an updated drill spacing study. An additional 3.0 million ounces of negative impact from higher cost expectations for future caves net of benefits from higher price assumptions
- Namosi resources of 5.0 million ounces were removed from resources as Newmont further evaluates the project
- Yanacocha resources increased by 4.3 million ounces, primarily driven by 4.5 million ounces reclassified from reserves from Yanacocha Sulfides, aligned with Newmont’s decision to indefinitely defer the project
- Ahafo South resources increased 45 percent to 7.4 million ounces, primarily driven by 1.7 million ounces of resource additions largely at Apensu underground
Article content
Newmont’s Measured and Indicated Gold Mineral Resource grade decreased to 0.58 grams per tonne compared to 0.59 grams per tonne in the prior year. Inferred Gold Mineral Resource increased to 0.9 grams per tonne compared to 0.6 grams per tonne in the prior year, largely due to the removal of inferred resources from Namosi and assets divested.
Article content
Article content
| _______________________________________ | ||
4 | Total resources presented includes Measured and Indicated resources of 88.1 million attributable gold ounces and Inferred resources of 60.6 million attributable gold ounces. See cautionary statement at the end of this release. | |
5 | Net Conversion inclusive of ounces reclassified from reserves to resources. | |
6 | Assets divested in 2025 were CC&V, United States; Musselwhite, Canada; Porcupine, Canada; Éléonore, Canada; and Akyem, Ghana. | |
7 | Includes Measured and Indicated as well as Inferred resources. See detailed tables that follow. | |
Article content
OTHER METALS
Article content
Copper reserves decreased slightly to 12.5 million tonnes from 13.5 million tonnes in the prior year, primarily due to reclassification of the Yanacocha Sulfides project to resources. Measured and Indicated copper resources decreased to 13.1 million tonnes from 14.1 million tonnes. Inferred copper resources decreased to 5.6 million tonnes from 11.0 million tonnes driven almost entirely by the removal of Namosi.
Article content
Silver reserves decreased to 442 million ounces compared to 530 million ounces in the prior year, primarily due to the reclassification of the Yanacocha Sulfides project to resources and depletion at Peñasquito. Measured and Indicated silver resources increased to 508 million ounces from 469 million ounces in the prior year while inferred silver resources increased to 126 million ounces from 113 million ounces in the prior year; both due to the reclassification of the Yanacocha Sulfides projects.
Article content
Lead reserves decreased slightly to 0.7 million tonnes from 0.8 million tonnes primarily due to depletion. Measured and Indicated lead resources were unchanged at 0.5 million tonnes. Zinc reserves decreased to 1.5 million tonnes from 1.7 million tonnes primarily due to depletion. Measured and Indicated zinc resources increased to 1.4 million tonnes from 1.2 million tonnes.
Article content
Molybdenum reserves were unchanged at 0.2 million tonnes. Measured and Indicated molybdenum resources remained unchanged at 0.1 million tonnes.
Article content
EXPLORATION OUTLOOK
Article content
Newmont’s attributable exploration expenditure for managed operations is expected to be approximately $205 million in 2026 with 80 percent of total exploration investment dedicated to near-mine expansion programs and brownfields with the remaining 20 percent allocated to the advancement of greenfield projects.
Article content
Article content
Additionally, Newmont’s share of exploration investment for its non-managed operations is expected to be approximately $35 million, for a total consolidated exploration expense outlook of $240 million for 2026.
Article content
Newmont expects to invest the largest proportion of exploration funds in prospective targets at Merian, Cerro Negro, and Ahafo South.
Article content
UPDATED GOLD PRICE FOR MINERAL RESERVES AND MINERAL RESOURCES
Article content
As part of the annual Mineral Reserves and Mineral Resources update, Newmont assesses the metal price assumptions used for the calculation of year-end reserves and resources.
Article content
In line with market conditions, Newmont has increased its reserves gold price assumption by 18 percent to $2,000 per ounce from $1,700 per ounce in 2024; which is less than 60 percent of the 2025 average realized gold price. Newmont’s updated reserves gold price is approximately 23 percent lower than the three-year trailing gold price average of $2,586 per ounce. Historically, over the last ten years (2015 – 2024), Newmont has assumed a reserve price approximately 13 percent below the three year trailing average. Consistent with Newmont’s historical approach, the resources gold price has been calibrated higher than reserves to allow identification of the optimum areas to further expand the life of its assets and to target where additional drilling and study work is required at its operating mines. For 2025, mineral resources are based on a $2,300 per ounce.
Article content
Newmont’s robust internal processes and proven track record of responsibly and rigorously defining reserves and resources will continue to support the development of its world-class portfolio and organic project pipeline.
Article content
GOLD RESERVE SENSITIVITY
Article content
A $100 increase in gold price would result in an approximate 5 percent increase in gold reserves while a $100 decrease in gold price would result in an approximate 2 percent decrease in gold reserves. These sensitivities assume an oil price of $75 per barrel (WTI), Australian dollar exchange rate of $0.70 and Canadian dollar exchange rate of $0.75. These sensitivities assume all other inputs remain equal, including all cost and capital assumptions, which may also have a material impact on these approximate estimates.
Article content
KEY RESERVE AND RESOURCE ASSUMPTIONS8 | ||
At December 31, | ||
2025 | 2024 | |
Gold Reserves ($/oz) | $2,000 | $1,700 |
Gold Resources ($/oz) | $2,300 | $2,000 |
Copper Reserves ($/lb) | $3.75 | $3.50 |
Copper Resources ($/lb) | $4.25 | $4.00 |
Silver Reserves ($/oz) | $25.00 | $20.00 |
Silver Resources ($/oz) | $28.00 | $23.00 |
Lead Reserves ($/lb) | $0.90 | $0.90 |
Lead Resources ($/lb) | $1.00 | $1.00 |
Zinc Reserves ($/lb) | $1.20 | $1.20 |
Zinc Resources ($/lb) | $1.30 | $1.30 |
Molybdenum Reserves ($/lb) | $13.00 | $13.00 |
Molybdenum Resources ($/lb) | $16.00 | $16.00 |
Australian Dollar (A$:US$) | $0.70 | $0.70 |
Canadian Dollar (C$:US$) | $0.75 | $0.75 |
West Texas Intermediate ($/bbl) | $75.00 | $75.00 |
Article content
For additional details on Newmont’s reported gold, copper, silver, lead, zinc, and molybdenum Mineral Reserves and Mineral Resources, please refer to the tables at the end of this release.
Article content
| _____________________________________________________ | ||
8 | For 2025 and 2024, Newmont reserves and resources were estimated using the price assumptions noted, except for certain sites as detailed in the footnotes of the reserves and resources tables below. | |
Article content
RESERVE AND RESOURCE TABLES
Article content
Proven and probable reserves are based on extensive drilling, sampling, mine modeling and metallurgical testing from which Newmont determined economic feasibility. The reference point for mineral reserves is the point of delivery to the process plant. Metal price assumptions, adjusted for Newmont’s exchange rate assumption, are based on considering such factors as market forecasts, industry consensus and management estimates. The price sensitivity of reserves depends upon several factors including grade, metallurgical recovery, operating cost, waste-to-ore ratio and ore type. Metallurgical recovery rates vary depending on the metallurgical properties of each deposit and the production process used. The reserve tables below list the average estimated in-situ metallurgical recovery rate for each deposit, which takes into account the relevant processing methods. The cut-off grade, or lowest grade of mineralization considered economic to process, varies between deposits depending upon prevailing economic conditions, mineability of the deposit, by-products, amenability of the ore to gold, copper, silver, lead, zinc or molybdenum extraction and type of milling or leaching facilities available. Reserve estimates may have non-material differences in comparison to our joint venture partners due to differences in classification and rounding methodology.
Article content
The proven and probable reserve figures presented herein are estimates based on information available at the time of calculation. No assurance can be given that the indicated levels of recovery of gold, copper, silver, lead, zinc and molybdenum will be realized. Ounces of gold or silver or tonnes of copper, lead, zinc or molybdenum included in the proven and probable reserves are those contained prior to losses during metallurgical treatment. Reserve estimates may require revision based on actual production. Market fluctuations in the price of gold, copper, silver, lead, zinc and molybdenum, as well as increased production costs or reduced metallurgical recovery rates, could render certain proven and probable reserves containing higher cost reserves uneconomic to exploit and might result in a reduction of reserves.
Article content
Article content
The measured, indicated, and inferred resource figures presented herein are estimates based on information available at the time of calculation and are exclusive of reserves. A “mineral resource” is a concentration or occurrence of solid material of economic interest in or on the Earth’s crust in such form, grade, or quality and quantity that there are reasonable prospects for eventual economic extraction. The location, quantity, grade or quality, continuity and other geological characteristics of a mineral resource are known, estimated or interpreted from specific geological evidence and knowledge, including sampling. The reference point for mineral resources is in situ. Mineral resources are sub-divided, in order of increasing geological confidence, into inferred, indicated and measured categories. Ounces of gold and silver or tonnes of copper, zinc, lead and molybdenum included in the measured, indicated and inferred resources are those contained prior to losses during metallurgical treatment. The terms “measured resource,” “indicated resource,” and “inferred resource” mean that part of a mineral resource for which quantity and grade or quality are estimated on the basis of geological evidence and sampling that is considered to be comprehensive, adequate, or limited, respectively. Market fluctuations in the price of gold, silver, copper, zinc, lead and molybdenum as well as increased production costs or reduced metallurgical recovery rates, could change future estimates of resources.
Article content
Newmont publishes reserves annually, and will recalculate reserves at December 31, 2026, taking into account metal prices, changes, if any, to future production and capital costs, divestments and conversion to reserves, as well as any acquisitions and additions during 2026.
Article content
Please refer to the reserves and resources cautionary statement at the end of the release.
Article content
Gold Reserves (1) | ||||||||||||||||||||||||||||||
December 31, 2025 | December 31, 2024 | |||||||||||||||||||||||||||||
Proven Reserves | Probable Reserves | Proven and Probable Reserves | Proven and Probable Reserves | |||||||||||||||||||||||||||
Deposits/Districts | Newmont Share | Tonnage (2) (000 tonnes) | Grade (g/tonne) | Ounces (3) (000) | Tonnage (2) (000 tonnes) | Grade (g/tonne) | Ounces (3) (000) | Tonnage (2) (000 tonnes) | Grade (g/tonne) | Ounces (3) (000) | Metallurgical Recovery (3) | Tonnage (2) (000 tonnes) | Grade (g/tonne) | Ounces (3) (000) | ||||||||||||||||
Lihir Open Pits | 100 | % | — | — | — | 147,900 | 2.55 | 12,100 | 147,900 | 2.55 | 12,100 | 76 | % | 125,900 | 2.86 | 11,600 | ||||||||||||||
Lihir Stockpiles (4) | 100 | % | — | — | — | 72,300 | 1.65 | 3,800 | 72,300 | 1.65 | 3,800 | 76 | % | 77,100 | 1.68 | 4,200 | ||||||||||||||
Total Lihir, Papua New Guinea (5) | 100 | % | — | — | — | 220,200 | 2.26 | 16,000 | 220,200 | 2.26 | 16,000 | 76 | % | 203,000 | 2.41 | 15,800 | ||||||||||||||
Wafi-Golpu, Papua New Guinea (6)(7) | 50 | % | — | — | — | 194,500 | 0.82 | 5,100 | 194,500 | 0.82 | 5,100 | 68 | % | 194,500 | 0.82 | 5,100 | ||||||||||||||
Cadia, Australia (8) | 100 | % | — | — | — | 1,007,600 | 0.42 | 13,500 | 1,007,600 | 0.42 | 13,500 | 81 | % | 1,051,800 | 0.42 | 14,100 | ||||||||||||||
Tanami, Australia | 100 | % | 10,100 | 4.88 | 1,600 | 22,700 | 5.10 | 3,700 | 32,800 | 5.03 | 5,300 | 98 | % | 29,900 | 5.27 | 5,100 | ||||||||||||||
Boddington Open Pit | 100 | % | 265,300 | 0.62 | 5,300 | 216,300 | 0.58 | 4,100 | 481,700 | 0.60 | 9,300 | 85 | % | 495,700 | 0.62 | 9,900 | ||||||||||||||
Boddington Stockpiles (4) | 100 | % | 5,600 | 0.56 | 100 | 57,800 | 0.43 | 800 | 63,400 | 0.44 | 900 | 84 | % | 64,100 | 0.43 | 900 | ||||||||||||||
Total Boddington, Australia (9) | 100 | % | 271,000 | 0.61 | 5,400 | 274,100 | 0.55 | 4,900 | 545,100 | 0.58 | 10,200 | 85 | % | 559,800 | 0.60 | 10,800 | ||||||||||||||
Ahafo South Open Pit (10) | 100 | % | 2,500 | 1.16 | 100 | 40,900 | 1.48 | 1,900 | 43,400 | 1.46 | 2,000 | 88 | % | 42,000 | 1.63 | 2,200 | ||||||||||||||
Ahafo South Underground (11) | 100 | % | 9,400 | 2.51 | 800 | 10,000 | 2.23 | 700 | 19,400 | 2.37 | 1,500 | 94 | % | 21,300 | 2.54 | 1,700 | ||||||||||||||
Ahafo South Stockpiles (4)(12) | 100 | % | 18,500 | 0.94 | 600 | — | — | — | 18,500 | 0.94 | 600 | 91 | % | 21,700 | 0.97 | 700 | ||||||||||||||
Total Ahafo South, Ghana | 100 | % | 30,400 | 1.44 | 1,400 | 50,900 | 1.63 | 2,700 | 81,300 | 1.56 | 4,100 | 91 | % | 85,000 | 1.69 | 4,600 | ||||||||||||||
Ahafo North, Ghana (13) | 100 | % | — | — | — | 65,500 | 2.23 | 4,700 | 65,500 | 2.23 | 4,700 | 89 | % | 62,000 | 2.32 | 4,600 | ||||||||||||||
Total Ahafo Complex, Ghana | 100 | % | 30,400 | 1.44 | 1,400 | 116,500 | 1.97 | 7,400 | 146,900 | 1.86 | 8,800 | 90 | % | 147,000 | 1.96 | 9,200 | ||||||||||||||
Merian, Suriname | 75 | % | 24,800 | 1.21 | 1,000 | 104,600 | 1.06 | 3,600 | 129,400 | 1.09 | 4,500 | 93 | % | 110,700 | 1.16 | 4,100 | ||||||||||||||
Cerro Negro, Argentina | 100 | % | 2,200 | 11.20 | 800 | 6,800 | 10.38 | 2,300 | 9,000 | 10.58 | 3,000 | 94 | % | 9,300 | 10.82 | 3,200 | ||||||||||||||
Pueblo Viejo Open Pit | 40 | % | 35,800 | 2.22 | 2,600 | 51,300 | 1.95 | 3,200 | 87,100 | 2.06 | 5,800 | 81 | % | 81,700 | 2.13 | 5,600 | ||||||||||||||
Pueblo Viejo Stockpiles (4) | 40 | % | — | — | — | 36,900 | 2.04 | 2,400 | 36,900 | 2.04 | 2,400 | 81 | % | 38,800 | 2.07 | 2,600 | ||||||||||||||
Total Pueblo Viejo, Dominican Republic (7)(14) | 40 | % | 35,800 | 2.22 | 2,600 | 88,200 | 1.99 | 5,600 | 123,900 | 2.06 | 8,200 | 81 | % | 120,500 | 2.11 | 8,200 | ||||||||||||||
NuevaUnión, Chile (7)(15) | 50 | % | — | — | — | 341,100 | 0.47 | 5,100 | 341,100 | 0.47 | 5,100 | 66 | % | 341,100 | 0.47 | 5,100 | ||||||||||||||
Norte Abierto, Chile (7)(16) | 50 | % | — | — | — | 521,100 | 0.65 | 10,800 | 521,100 | 0.65 | 10,800 | 86 | % | 598,800 | 0.60 | 11,600 | ||||||||||||||
Yanacocha, Peru | 100 | % | 18,800 | 0.81 | 500 | — | — | — | 18,800 | 0.81 | 500 | 71 | % | 126,400 | 1.31 | 5,300 | ||||||||||||||
Peñasquito Open Pits | 100 | % | 79,500 | 0.54 | 1,400 | 114,800 | 0.44 | 1,600 | 194,300 | 0.48 | 3,000 | 62 | % | 224,700 | 0.52 | 3,800 | ||||||||||||||
Peñasquito Stockpiles (4) | 100 | % | 4,900 | 0.44 | 100 | 21,800 | 0.21 | 100 | 26,700 | 0.25 | 200 | 45 | % | 32,000 | 0.26 | 300 | ||||||||||||||
Total Peñasquito, Mexico | 100 | % | 84,400 | 0.53 | 1,400 | 136,600 | 0.40 | 1,800 | 221,000 | 0.45 | 3,200 | 61 | % | 256,600 | 0.49 | 4,100 | ||||||||||||||
Red Chris, Canada (17) | 70 | % | 2,600 | 0.32 | — | 178,900 | 0.63 | 3,600 | 181,500 | 0.62 | 3,600 | 69 | % | 186,400 | 0.62 | 3,700 | ||||||||||||||
Brucejack, Canada | 100 | % | — | — | — | 13,500 | 6.65 | 2,900 | 13,500 | 6.65 | 2,900 | 96 | % | 8,600 | 6.95 | 1,900 | ||||||||||||||
NGM Open Pit (18) | 38.5 | % | — | — | — | 131,100 | 1.02 | 4,300 | 131,100 | 1.02 | 4,300 | 75 | % | 124,200 | 1.16 | 4,600 | ||||||||||||||
NGM Stockpiles (4)(19) | 38.5 | % | 6,800 | 1.29 | 300 | 20,800 | 2.35 | 1,600 | 27,600 | 2.09 | 1,800 | 67 | % | 29,200 | 2.08 | 2,000 | ||||||||||||||
NGM Underground (20) | 38.5 | % | 4,200 | 11.67 | 1,600 | 37,900 | 7.93 | 9,700 | 42,100 | 8.30 | 11,200 | 84 | % | 43,700 | 8.06 | 11,300 | ||||||||||||||
Total NGM, United States (21) | 38.5 | % | 10,900 | 5.24 | 1,800 | 189,800 | 2.54 | 15,500 | 200,700 | 2.69 | 17,400 | 80 | % | 197,100 | 2.82 | 17,900 | ||||||||||||||
Divested (22) | ||||||||||||||||||||||||||||||
CC&V Open Pit | 115,600 | 0.43 | 1,600 | |||||||||||||||||||||||||||
CC&V Leach Pads (23) | 34,600 | 0.73 | 800 | |||||||||||||||||||||||||||
Total CC&V, United States | 150,200 | 0.50 | 2,400 | |||||||||||||||||||||||||||
Musselwhite, Canada | 7,400 | 6.43 | 1,500 | |||||||||||||||||||||||||||
Porcupine Underground | 4,400 | 6.46 | 900 | |||||||||||||||||||||||||||
Porcupine Open Pit | 30,600 | 1.46 | 1,500 | |||||||||||||||||||||||||||
Total Porcupine, Canada | 34,900 | 2.09 | 2,300 | |||||||||||||||||||||||||||
Éléonore, Canada | 10,100 | 5.05 | 1,600 | |||||||||||||||||||||||||||
Akyem Open Pit | 18,200 | 1.54 | 900 | |||||||||||||||||||||||||||
Akyem Stockpiles (4) | 700 | 0.72 | — | |||||||||||||||||||||||||||
Total Akyem, Ghana | 19,000 | 1.51 | 900 | |||||||||||||||||||||||||||
Total Gold | 490,900 | 1.04 | 16,500 | 3,416,100 | 0.93 | 101,800 | 3,907,000 | 0.94 | 118,200 | 81 | % | 4,363,000 | 0.96 | 134,100 | ||||||||||||||||
Article content
Article content
____________________________ | ||
(1) | At December 31, 2025 and 2024, gold reserves at sites for which Newmont is the operator were estimated at a gold price of $2,000 and $1,700 per ounce, respectively, unless otherwise noted. Reserves provided by other operators may use pricing that differs. Amounts presented may not recalculate in total due to rounding. | |
(2) | Tonnages include allowances for losses resulting from mining methods. Tonnages are rounded to the nearest 100,000. | |
(3) | Ounces are estimates of metal contained in ore tonnages and do not include allowances for processing losses. Metallurgical recovery rates represent the estimated amount of metal to be recovered through metallurgical extraction processes. Ounces may not recalculate as they are rounded to the nearest 100,000. | |
(4) | Stockpiles are comprised primarily of material that has been set aside to allow processing of higher grade material in the mills. Stockpiles increase or decrease depending on current mine plans. Stockpile reserves are reported separately where ounces exceed 100,000 and are greater than 5% of the total site-reported reserves. | |
(5) | Cut-off grade utilized in 2025 reserves not less than 1.00 gram per tonne. | |
(6) | Project is currently undeveloped. Gold reserves at December 31, 2025 were estimated at a gold price of $1,200 per ounce. | |
(7) | Included in the non-operating segment Corporate and Other in Note 4 to the Consolidated Financial Statements. | |
(8) | The net smelter return value utilized in 2025 reserves not less than $24.62 per tonne. | |
(9) | The net smelter return value utilized in 2025 reserves not less than $18.24 per tonne. | |
(10) | Cut-off grade utilized in 2025 reserves not less than 0.49 gram per tonne. | |
(11) | Cut-off grade utilized in 2025 reserves not less than 1.80 gram per tonne. | |
(12) | Cut-off grade utilized in 2025 reserves not less than 0.48 gram per tonne. | |
(13) | Cut-off grade utilized in 2025 reserves not less than 0.60 gram per tonne. | |
(14) | The Pueblo Viejo mine, which is 40% owned by Newmont, is accounted for as an equity method investment. Gold reserves at December 31, 2025 were estimated at a gold price of $1,500 per ounce. Gold reserves at December 31, 2025 and 2024 were provided by Barrick, the operator of Pueblo Viejo. | |
(15) | Project is currently undeveloped. Gold reserves at December 31, 2025 were estimated at a gold price of $1,300 per ounce. Gold reserves at December 31, 2025 and 2024 were provided by the NuevaUnión joint venture. | |
(16) | Project is currently undeveloped. Gold reserves at December 31, 2025 were estimated at a gold price of $1,700 per ounce. Gold reserves at December 31, 2025 and 2024 were provided by the Norte Abierto joint venture. | |
(17) | Gold reserves related to the underground mine at December 31, 2025 were estimated at a gold price of $1,300 per ounce. | |
(18) | Cut-off grade utilized in 2025 reserves not less than 0.15 gram per tonne. | |
(19) | Cut-off grade utilized in 2025 reserves not less than 0.44 gram per tonne. | |
(20) | Cut-off grade utilized in 2025 reserves not less than 3.34 gram per tonne. | |
(21) | Gold reserves at December 31, 2025 were estimated at a gold price of $1,500 per ounce. Gold reserves at December 31, 2025 and 2024 were provided by Barrick, the operator of the NGM joint venture. | |
(22) | Sites were classified as held for sale as of December 31, 2024 and were divested as of December 31, 2025. Refer to Note 3 of the Consolidated Financial Statements for further information on the Company’s divestitures. | |
(23) | Leach pad material is the material on leach pads at the end of the year from which gold remains to be recovered. In-process reserves are reported separately where ounces exceed 100,000 and are greater than 5% of the total site-reported reserves. | |
Article content
Gold Resources at December 31, 2025 (1)(2) | ||||||||||||||||||||||||||||||
Measured Resource | Indicated Resource | Measured and Indicated Resource | Inferred Resource | |||||||||||||||||||||||||||
Deposits/Districts | Newmont Share | Tonnage (000 tonnes) | Grade (g/tonne) | Ounces(3) (000) | Tonnage (000 tonnes) | Grade (g/tonne) | Ounces(3) (000) | Tonnage (000 tonnes) | Grade (g/tonne) | Ounces(3) (000) | Tonnage (000 tonnes) | Grade (g/tonne) | Ounces(3) (000) | Metallurgical Recovery (3) | ||||||||||||||||
Lihir, Papua New Guinea | 100 | % | — | — | — | 37,500 | 1.99 | 2,400 | 37,500 | 1.99 | 2,400 | 239,800 | 2.4 | 18,300 | 75 | % | ||||||||||||||
Wafi-Golpu Open Pit (4) | 50 | % | — | — | — | 53,600 | 1.66 | 2,900 | 53,600 | 1.66 | 2,900 | 15,500 | 1.3 | 600 | 65 | % | ||||||||||||||
Wafi-Golpu Underground (5) | 50 | % | — | — | — | 140,800 | 0.45 | 2,000 | 140,800 | 0.45 | 2,000 | 91,900 | 0.6 | 1,900 | 68 | % | ||||||||||||||
Total Wafi-Golpu, Papua New Guinea (6) | 50 | % | — | — | — | 194,500 | 0.78 | 4,900 | 194,500 | 0.78 | 4,900 | 107,300 | 0.7 | 2,600 | 67 | % | ||||||||||||||
Cadia Underground | 100 | % | — | — | — | 1,009,300 | 0.29 | 9,400 | 1,009,300 | 0.29 | 9,400 | 163,900 | 0.2 | 1,300 | 81 | % | ||||||||||||||
Cadia Stockpiles | 100 | % | 28,500 | 0.30 | 300 | — | — | — | 28,500 | 0.30 | 300 | — | — | — | 64 | % | ||||||||||||||
Total Cadia, Australia | 100 | % | 28,500 | 0.30 | 300 | 1,009,300 | 0.29 | 9,400 | 1,037,800 | 0.29 | 9,700 | 163,900 | 0.2 | 1,300 | 81 | % | ||||||||||||||
Tanami Open Pit | 100 | % | 10,000 | 1.62 | 500 | 27,300 | 1.42 | 1,200 | 37,200 | 1.47 | 1,800 | 5,500 | 1.1 | 200 | 90 | % | ||||||||||||||
Tanami Underground | 100 | % | 2,600 | 3.35 | 300 | 6,800 | 3.77 | 800 | 9,400 | 3.65 | 1,100 | 17,600 | 4.4 | 2,500 | 96 | % | ||||||||||||||
Total Tanami, Australia | 100 | % | 12,500 | 1.98 | 800 | 34,100 | 1.89 | 2,100 | 46,600 | 1.91 | 2,900 | 23,100 | 3.6 | 2,700 | 94 | % | ||||||||||||||
Boddington, Australia | 100 | % | 97,300 | 0.52 | 1,600 | 168,200 | 0.49 | 2,600 | 265,500 | 0.50 | 4,300 | 3,800 | 0.5 | 100 | 85 | % | ||||||||||||||
Ahafo South Open Pit | 100 | % | 1,000 | 1.13 | — | 5,000 | 0.72 | 100 | 6,100 | 0.79 | 200 | 3,200 | 1.1 | 100 | 87 | % | ||||||||||||||
Ahafo South Underground | 100 | % | 1,200 | — | 100 | 41,400 | 3.84 | 5,100 | 42,500 | 3.84 | 5,200 | 19,500 | 2.9 | 1,800 | 91 | % | ||||||||||||||
Total Ahafo South, Ghana | 100 | % | 2,200 | 2.49 | 200 | 46,400 | 3.51 | 5,200 | 48,600 | 3.46 | 5,400 | 22,700 | 2.7 | 2,000 | 91 | % | ||||||||||||||
Ahafo North, Ghana | 100 | % | 6,600 | 1.44 | 300 | 36,300 | 1.74 | 2,000 | 42,900 | 1.69 | 2,300 | 18,100 | 1.6 | 900 | 90 | % | ||||||||||||||
Total Ahafo Complex, Ghana | 100 | % | 8,700 | 1.70 | 500 | 82,700 | 2.73 | 7,300 | 91,400 | 2.63 | 7,700 | 40,900 | 2.2 | 2,900 | 91 | % | ||||||||||||||
Merian, Suriname | 75 | % | 5,200 | 0.96 | 200 | 49,600 | 1.05 | 1,700 | 54,800 | 1.05 | 1,800 | 79,700 | 0.8 | 2,100 | 90 | % | ||||||||||||||
Cerro Negro, Argentina | 100 | % | 1,300 | 3.73 | 200 | 1,900 | 5.42 | 300 | 3,200 | 4.73 | 500 | 7,500 | 5.1 | 1,200 | 95 | % | ||||||||||||||
Pueblo Viejo, Dominican Republic (6)(7) | 40 | % | 7,300 | 1.31 | 300 | 33,100 | 1.37 | 1,500 | 40,300 | 1.36 | 1,800 | 6,300 | 1.5 | 300 | 81 | % | ||||||||||||||
NuevaUnión, Chile (6)(8) | 50 | % | 4,800 | 0.47 | 100 | 118,300 | 0.59 | 2,300 | 123,100 | 0.59 | 2,300 | 239,800 | 0.4 | 3,100 | 68 | % | ||||||||||||||
Norte Abierto, Chile (6)(9) | 50 | % | 77,700 | 0.61 | 1,500 | 525,500 | 0.51 | 8,600 | 603,200 | 0.52 | 10,100 | 381,100 | 0.4 | 5,300 | 78 | % | ||||||||||||||
Conga, Peru (6)(10) | 100 | % | — | — | — | 693,800 | 0.65 | 14,600 | 693,800 | 0.65 | 14,600 | 230,500 | 0.4 | 2,900 | 75 | % | ||||||||||||||
Yanacocha Open Pit | 100 | % | 12,800 | 0.41 | 200 | 99,100 | 0.70 | 2,300 | 111,900 | 0.67 | 2,400 | 360,300 | 0.5 | 6,200 | 58 | % | ||||||||||||||
Yanacocha Underground | 100 | % | 3,800 | 7.28 | 900 | 15,200 | 5.13 | 2,500 | 19,000 | 5.56 | 3,400 | 3,600 | 4.9 | 600 | 97 | % | ||||||||||||||
Total Yanacocha, Peru (11) | 100 | % | 16,600 | 1.98 | 1,100 | 114,300 | 1.29 | 4,700 | 130,900 | 1.38 | 5,800 | 363,900 | 0.6 | 6,700 | 71 | % | ||||||||||||||
Peñasquito, Mexico | 100 | % | 52,800 | 0.30 | 500 | 172,100 | 0.21 | 1,100 | 224,900 | 0.23 | 1,600 | 9,200 | 0.2 | 100 | 56 | % | ||||||||||||||
La Bikina, Mexico (6) | 50 | % | — | — | — | 19,900 | 0.37 | 200 | 19,900 | 0.37 | 200 | 1,600 | 0.2 | — | 50 | % | ||||||||||||||
Galore Creek, Canada (6)(12) | 50 | % | 212,800 | 0.29 | 2,000 | 385,600 | 0.22 | 2,700 | 598,400 | 0.25 | 4,700 | 118,900 | 0.2 | 700 | 75 | % | ||||||||||||||
Red Chris, Canada (13) | 70 | % | — | — | — | 334,800 | 0.34 | 3,700 | 334,800 | 0.34 | 3,700 | 62,000 | 0.3 | 700 | 55 | % | ||||||||||||||
Brucejack, Canada | 100 | % | — | — | — | 4,300 | 4.13 | 600 | 4,300 | 4.13 | 600 | 14,500 | 5.3 | 2,500 | 96 | % | ||||||||||||||
NGM Open Pit | 38.5 | % | 2,900 | 1.04 | 100 | 178,000 | 0.64 | 3,600 | 180,900 | 0.64 | 3,700 | 63,200 | 0.8 | 1,500 | 75 | % | ||||||||||||||
NGM Underground | 38.5 | % | 1,400 | 8.83 | 400 | 21,900 | 6.34 | 4,500 | 23,400 | 6.50 | 4,900 | 25,600 | 6.9 | 5,700 | 82 | % | ||||||||||||||
Total NGM, Nevada (14) | 38.5 | % | 4,300 | 3.61 | 500 | 199,900 | 1.26 | 8,100 | 204,300 | 1.31 | 8,600 | 88,900 | 2.5 | 7,300 | 80 | % | ||||||||||||||
Total Gold | 529,900 | 0.56 | 9,500 | 4,179,300 | 0.59 | 78,700 | 4,709,300 | 0.58 | 88,100 | 2,182,600 | 0.9 | 60,600 | 78 | % | ||||||||||||||||
Article content
Article content
Gold Resources (1)(2) – December 31, 2024 | ||||||||||||||||||||||||||||||
Measured Resource | Indicated Resource | Measured and Indicated Resource | Inferred Resource | |||||||||||||||||||||||||||
Deposits/Districts | Newmont Share | Tonnage (000 tonnes) | Grade (g/tonne) | Ounces(3) (000) | Tonnage (000 tonnes) | Grade (g/tonne) | Ounces(3) (000) | Tonnage (000 tonnes) | Grade (g/tonne) | Ounces(3) (000) | Tonnage (000 tonnes) | Grade (g/tonne) | Ounces(3) (000) | Metallurgical Recovery (3) | ||||||||||||||||
Namosi, Fiji | 73.24 | % | — | — | — | 105,500 | 0.22 | 700 | 105,500 | 0.22 | 700 | 1,346,900 | 0.1 | 4,300 | 72 | % | ||||||||||||||
Lihir, Papua New Guinea | 100 | % | — | — | — | 44,600 | 1.97 | 2,800 | 44,600 | 1.97 | 2,800 | 227,400 | 2.4 | 17,600 | 75 | % | ||||||||||||||
Wafi-Golpu Open Pit | 50 | % | — | — | — | 53,600 | 1.66 | 2,900 | 53,600 | 1.66 | 2,900 | 15,500 | 1.3 | 600 | 65 | % | ||||||||||||||
Wafi-Golpu Underground | 50 | % | — | — | — | 140,800 | 0.45 | 2,000 | 140,800 | 0.45 | 2,000 | 91,900 | 0.6 | 1,900 | 68 | % | ||||||||||||||
Total Wafi-Golpu, Papua New Guinea (6) | 50 | % | — | — | — | 194,500 | 0.78 | 4,900 | 194,500 | 0.78 | 4,900 | 107,300 | 0.7 | 2,600 | 67 | % | ||||||||||||||
Cadia Underground | 100 | % | — | — | — | 1,245,100 | 0.36 | 14,200 | 1,245,100 | 0.36 | 14,200 | 549,400 | 0.3 | 4,800 | 81 | % | ||||||||||||||
Cadia Open Pit | 100 | % | 30,800 | 0.30 | 300 | — | — | — | 30,800 | 0.30 | 300 | 11,000 | 0.7 | 200 | 65 | % | ||||||||||||||
Total Cadia, Australia | 100 | % | 30,800 | 0.30 | 300 | 1,245,100 | 0.36 | 14,200 | 1,275,900 | 0.35 | 14,500 | 560,400 | 0.3 | 5,000 | 81 | % | ||||||||||||||
Tanami Open Pit | 100 | % | 9,700 | 1.65 | 500 | 26,500 | 1.45 | 1,200 | 36,200 | 1.50 | 1,700 | 5,300 | 1.1 | 200 | 90 | % | ||||||||||||||
Tanami Underground | 100 | % | 2,800 | 3.22 | 300 | 6,600 | 3.80 | 800 | 9,300 | 3.63 | 1,100 | 17,200 | 4.4 | 2,400 | 97 | % | ||||||||||||||
Total Tanami, Australia | 100 | % | 12,500 | 1.99 | 800 | 33,000 | 1.92 | 2,000 | 45,500 | 1.94 | 2,800 | 22,500 | 3.6 | 2,600 | 94 | % | ||||||||||||||
Boddington, Australia | 100 | % | 90,600 | 0.55 | 1,600 | 154,100 | 0.53 | 2,600 | 244,700 | 0.54 | 4,200 | 3,500 | 0.6 | 100 | 84 | % | ||||||||||||||
Ahafo South Open Pit | 100 | % | 3,900 | 1.13 | 100 | 6,500 | 0.83 | 200 | 10,400 | 0.95 | 300 | 3,500 | 1.2 | 100 | 85 | % | ||||||||||||||
Ahafo South Underground | 100 | % | 700 | 3.85 | 100 | 27,100 | 3.96 | 3,400 | 27,800 | 3.95 | 3,500 | 11,500 | 3.1 | 1,200 | 91 | % | ||||||||||||||
Total Ahafo South, Ghana | 100 | % | 4,700 | 1.56 | 200 | 33,500 | 3.35 | 3,600 | 38,200 | 3.13 | 3,800 | 15,000 | 2.7 | 1,300 | 91 | % | ||||||||||||||
Ahafo North, Ghana | 100 | % | 6,900 | 1.41 | 300 | 28,300 | 1.78 | 1,600 | 35,200 | 1.71 | 1,900 | 13,700 | 1.6 | 700 | 90 | % | ||||||||||||||
Total Ahafo Complex, Ghana | 100 | % | 11,600 | 1.47 | 500 | 61,800 | 2.64 | 5,200 | 73,400 | 2.45 | 5,700 | 28,700 | 2.2 | 2,000 | 91 | % | ||||||||||||||
Merian, Suriname | 75 | % | 5,800 | 1.03 | 200 | 58,600 | 1.08 | 2,000 | 64,500 | 1.08 | 2,200 | 70,000 | 0.9 | 2,000 | 90 | % | ||||||||||||||
Cerro Negro, Argentina | 100 | % | 1,300 | 3.77 | 200 | 1,900 | 5.65 | 300 | 3,200 | 4.88 | 500 | 7,600 | 4.8 | 1,200 | 94 | % | ||||||||||||||
Pueblo Viejo, Dominican Republic (6)(7) | 40 | % | 8,200 | 1.39 | 400 | 38,200 | 1.44 | 1,800 | 46,400 | 1.43 | 2,100 | 5,000 | 1.6 | 300 | 88 | % | ||||||||||||||
NuevaUnión, Chile (6)(8) | 50 | % | 4,800 | 0.47 | 100 | 118,300 | 0.59 | 2,300 | 123,100 | 0.59 | 2,300 | 239,800 | 0.4 | 3,100 | 68 | % | ||||||||||||||
Norte Abierto, Chile (6)(9) | 50 | % | 77,200 | 0.61 | 1,500 | 596,900 | 0.49 | 9,300 | 674,200 | 0.50 | 10,800 | 369,600 | 0.4 | 4,400 | 76 | % | ||||||||||||||
Conga, Peru (6) | 100 | % | — | — | — | 693,800 | 0.65 | 14,600 | 693,800 | 0.65 | 14,600 | 230,500 | 0.4 | 2,900 | 75 | % | ||||||||||||||
Yanacocha Open Pit | 100 | % | 16,600 | 0.41 | 200 | 109,200 | 0.40 | 1,400 | 125,700 | 0.40 | 1,600 | 287,200 | 0.6 | 5,100 | 66 | % | ||||||||||||||
Yanacocha Underground | 100 | % | 500 | 4.07 | 100 | 6,200 | 4.70 | 900 | 6,700 | 4.65 | 1,000 | 3,400 | 5.0 | 500 | 97 | % | ||||||||||||||
Total Yanacocha, Peru | 100 | % | 17,100 | 0.52 | 300 | 115,400 | 0.63 | 2,300 | 132,500 | 0.62 | 2,600 | 290,700 | 0.6 | 5,600 | 72 | % | ||||||||||||||
Peñasquito, Mexico | 100 | % | 48,200 | 0.30 | 500 | 163,100 | 0.22 | 1,100 | 211,300 | 0.24 | 1,600 | 21,100 | 0.2 | 100 | 57 | % | ||||||||||||||
La Bikina, Mexico (6) | 50 | % | — | — | — | 19,900 | 0.37 | 200 | 19,900 | 0.37 | 200 | 1,600 | 0.2 | — | 50 | % | ||||||||||||||
Galore Creek, Canada (6)(12) | 50 | % | 212,800 | 0.29 | 2,000 | 385,600 | 0.22 | 2,700 | 598,400 | 0.25 | 4,700 | 118,900 | 0.2 | 700 | 75 | % | ||||||||||||||
Red Chris, Canada | 70 | % | — | — | — | 335,100 | 0.34 | 3,700 | 335,100 | 0.34 | 3,700 | 62,100 | 0.3 | 700 | 55 | % | ||||||||||||||
Brucejack, Canada | 100 | % | — | — | — | 4,300 | 4.68 | 600 | 4,300 | 4.68 | 600 | 16,600 | 5.8 | 3,100 | 96 | % | ||||||||||||||
NGM Open Pit | 38.5 | % | 3,700 | 1.24 | 100 | 158,500 | 0.74 | 3,800 | 162,200 | 0.76 | 4,000 | 56,700 | 0.9 | 1,600 | 72 | % | ||||||||||||||
NGM Underground | 38.5 | % | 200 | 23.55 | 200 | 21,500 | 6.34 | 4,400 | 21,800 | 6.52 | 4,600 | 25,100 | 6.4 | 5,200 | 87 | % | ||||||||||||||
Total NGM, United States (14) | 38.5 | % | 3,900 | 2.51 | 300 | 180,000 | 1.41 | 8,200 | 183,900 | 1.44 | 8,500 | 81,800 | 2.6 | 6,700 | 82 | % | ||||||||||||||
Held for sale (15) | ||||||||||||||||||||||||||||||
CC&V, United States | 100 | % | 20,300 | 0.53 | 300 | 26,500 | 0.48 | 400 | 46,700 | 0.50 | 800 | 71,400 | 0.4 | 900 | 51 | % | ||||||||||||||
Musselwhite, Canada | 100 | % | 1,500 | 4.21 | 200 | 2,300 | 4.10 | 300 | 3,800 | 4.15 | 500 | 1,900 | 5.0 | 300 | 96 | % | ||||||||||||||
Porcupine Underground | 100 | % | — | — | — | 1,000 | 7.70 | 300 | 1,100 | 7.59 | 300 | 1,900 | 7.8 | 500 | 92 | % | ||||||||||||||
Porcupine Open Pit | 100 | % | — | — | — | 75,600 | 1.51 | 3,700 | 75,600 | 1.51 | 3,700 | 65,900 | 1.4 | 2,900 | 92 | % | ||||||||||||||
Total Porcupine, Canada | 100 | % | — | — | — | 76,600 | 1.59 | 3,900 | 76,600 | 1.59 | 3,900 | 67,900 | 1.5 | 3,400 | 92 | % | ||||||||||||||
Éléonore, Canada | 100 | % | 400 | 4.94 | 100 | 2,900 | 4.11 | 400 | 3,300 | 4.21 | 400 | 2,400 | 4.6 | 400 | 92 | % | ||||||||||||||
Coffee, Canada (6) | 100 | % | 900 | 2.14 | 100 | 49,300 | 1.26 | 2,000 | 50,200 | 1.28 | 2,100 | 6,700 | 1.0 | 200 | 81 | % | ||||||||||||||
Akyem, Ghana | 100 | % | 800 | 0.73 | — | 9,700 | 3.83 | 1,200 | 10,600 | 3.58 | 1,200 | 5,500 | 3.0 | 500 | 92 | % | ||||||||||||||
Total Gold | 548,800 | 0.53 | 9,300 | 4,717,000 | 0.59 | 90,100 | 5,265,900 | 0.59 | 99,400 | 3,967,800 | 0.6 | 70,600 | 78 | % | ||||||||||||||||
Article content
Article content
____________________________ | ||
(1) | Resources are reported exclusive of reserves. Amounts presented may not recalculate in total due to rounding. | |
(2) | At December 31, 2025 and 2024, gold resources at sites for which Newmont is the operator were estimated at a gold price of $2,300 and $2,000 per ounce, respectively, unless otherwise noted. Resources provided by other operators may use pricing that differs. Tonnage amounts have been rounded to the nearest 100,000. | |
(3) | Ounces are estimates of metal contained in ore tonnages and do not include allowances for processing losses. Metallurgical recovery rates represent the estimated amount of metal to be recovered through metallurgical extraction processes. Ounces may not recalculate as they are rounded to the nearest 100,000. | |
(4) | Project is currently undeveloped. Gold resources at December 31, 2025 were estimated at a gold price of $1,400 per ounce. | |
(5) | Project is currently undeveloped. Gold resources at December 31, 2025 were estimated at a gold price of $1,300 per ounce. | |
(6) | Included in the non-operating segment Corporate and Other in Note 4 to the Consolidated Financial Statements. | |
(7) | The Pueblo Viejo mine, which is 40% owned by Newmont, is accounted for as an equity method investment. Gold resources at December 31, 2025 were estimated at a gold price of $2,000 per ounce. Gold resources at December 31, 2025 and 2024 were provided by Barrick, the operator of Pueblo Viejo. | |
(8) | Project is currently undeveloped. Gold resources at December 31, 2025 were estimated at a gold price of $1,300 per ounce. Gold resources at December 31, 2025 and 2024 were provided by the NuevaUnión joint venture. | |
(9) | Project is currently undeveloped. Gold resources at December 31, 2025 were estimated at a gold price of $2,000 per ounce. Gold resources at December 31, 2025 and 2024 were provided by the Norte Abierto joint venture. | |
(10) | Gold resources at December 31, 2025 were estimated at a gold price of $1,400 per ounce. | |
(11) | Gold resources related to the Yanacocha Sulfides project at December 31, 2025 were estimated at a gold price of $1,400 per ounce. | |
(12) | Project is currently undeveloped. Resource estimates provided by Teck Resources, the Galore Creek joint venture partner. | |
(13) | Gold resources related to the underground mine at December 31, 2025 were estimated at a gold price of $1,400 per ounce. | |
(14) | Gold resources at December 31, 2025 were estimated at a gold price of $2,000 per ounce. Gold resources at December 31, 2025 and 2024 were provided by Barrick, the operator of the NGM joint venture. | |
(15) | Sites were classified as held for sale as of December 31, 2024 and were divested as of December 31, 2025. Refer to Note 3 of the Consolidated Financial Statements for further information on the Company’s divestitures. | |
Article content
Copper Reserves (1) | ||||||||||||||||||||||||||||||||||
December 31, 2025 | December 31, 2024 | |||||||||||||||||||||||||||||||||
Proven Reserves | Probable Reserves | Proven and Probable Reserves | Proven and Probable Reserves | |||||||||||||||||||||||||||||||
Deposits/Districts | Newmont Share | Tonnage (2) (000 tonnes) | Grade (Cu %) | Tonnes (3) (000) | Tonnage (2) (000 tonnes) | Grade (Cu %) | Tonnes (3) (000) | Tonnage (2) (000 tonnes) | Grade (Cu %) | Tonnes (3) (000) | Metallurgical Recovery (3) | Tonnage (2) (000 tonnes) | Grade (Cu %) | Tonnes (3) (000) | ||||||||||||||||||||
Wafi-Golpu, Papua New Guinea (4)(5) | 50 | % | — | — | % | — | 194,500 | 1.20 | % | 2,300 | 194,500 | 1.20 | % | 2,300 | 95 | % | 194,500 | 1.20 | % | 2,300 | ||||||||||||||
Cadia, Australia (6) | 100 | % | — | — | % | — | 1,007,600 | 0.29 | % | 2,900 | 1,007,600 | 0.29 | % | 2,900 | 87 | % | 1,051,800 | 0.29 | % | 3,100 | ||||||||||||||
Boddington, Australia (7) | 100 | % | 271,000 | 0.09 | % | 200 | 274,100 | 0.10 | % | 300 | 545,100 | 0.09 | % | 500 | 81 | % | 559,800 | 0.09 | % | 500 | ||||||||||||||
NuevaUnión, Chile (5)(8) | 50 | % | — | — | % | — | 1,118,000 | 0.40 | % | 4,400 | 1,118,000 | 0.40 | % | 4,400 | 88 | % | 1,118,000 | 0.40 | % | 4,400 | ||||||||||||||
Norte Abierto, Chile (5)(9) | 50 | % | — | — | % | — | 521,100 | 0.24 | % | 1,200 | 521,100 | 0.24 | % | 1,200 | 79 | % | 598,800 | 0.22 | % | 1,300 | ||||||||||||||
Yanacocha, Peru | 100 | % | — | — | % | — | — | — | % | — | — | — | % | — | — | % | 111,100 | 0.63 | % | 700 | ||||||||||||||
Red Chris, Canada (10) | 70 | % | 2,600 | 0.41 | % | — | 178,900 | 0.52 | % | 900 | 181,500 | 0.52 | % | 900 | 84 | % | 186,400 | 0.52 | % | 1,000 | ||||||||||||||
NGM, United States (11) | 38.5 | % | 3,700 | 0.15 | % | — | 76,500 | 0.18 | % | 100 | 80,200 | 0.18 | % | 100 | 68 | % | 75,400 | 0.18 | % | 100 | ||||||||||||||
Total Copper | 277,300 | 0.09 | % | 200 | 3,370,700 | 0.36 | % | 12,300 | 3,648,000 | 0.34 | % | 12,500 | 87 | % | 3,895,800 | 0.35 | % | 13,500 | ||||||||||||||||
Article content
____________________________ | ||
(1) | At December 31, 2025 and 2024, copper reserves at sites for which Newmont is the operator were estimated at a copper price of $3.75 and $3.50 per pound, respectively, unless otherwise noted. Reserves provided by other operators may use pricing that differs. Amounts presented may not recalculate in total due to rounding. | |
(2) | Tonnages include allowances for losses resulting from mining methods. Tonnages are rounded to nearest 100,000. | |
(3) | Tonnes are estimates of metal contained in ore tonnages and do not include allowances for processing losses. Metallurgical recovery rates represent the estimated amount of metal to be recovered through metallurgical extraction processes. Tonnes may not recalculate as they are rounded to the nearest 100,000. | |
(4) | Project is currently undeveloped. Copper reserves at December 31, 2025 were estimated at a copper price of $3.00 per pound. | |
(5) | Included in the non-operating segment Corporate and Other in Note 4 to the Consolidated Financial Statements. | |
(6) | The net smelter return value utilized in 2025 reserves not less than $24.62 per tonne. | |
(7) | The net smelter return value utilized in 2025 reserves not less than $18.24 per tonne. | |
(8) | Project is currently undeveloped. Copper reserves at December 31, 2025 were estimated at a copper price of $3.00 per pound. Copper reserves at December 31, 2025 and 2024 were provided by the NuevaUnión joint venture. | |
(9) | Project is currently undeveloped. Copper reserves at December 31, 2025 were estimated at a copper price of $3.50. Copper reserves at December 31, 2025 and 2024 were provided by the Norte Abierto joint venture. | |
(10) | Copper reserves related to the underground mine at December 31, 2025 were estimated at a copper price of $3.00 per pound. | |
(11) | Copper cut-off grade varies with gold and silver credits. Copper reserves at December 31, 2025 were estimated at a copper price of $3.25 per ounce. Copper reserves at December 31, 2025 and 2024 were provided by Barrick, the operator of the NGM joint venture. | |
Article content
Article content
Copper Resources (1)(2) – December 31, 2025 | ||||||||||||||||||||||||||||||||||
Measured Resource | Indicated Resource | Measured and Indicated Resource | Inferred Resource | |||||||||||||||||||||||||||||||
Deposits/Districts | Newmont Share | Tonnage (000 tonnes) | Grade (Cu%) | Tonnes (3) (000) | Tonnage (000 tonnes) | Grade (Cu%) | Tonnes (3) (000) | Tonnage (000 tonnes) | Grade (Cu%) | Tonnes (3) (000) | Tonnage (000 tonnes) | Grade (Cu%) | Tonnes (3) (000) | Metallurgical Recovery (3) | ||||||||||||||||||||
Wafi-Golpu, Papua New Guinea (4)(5) | 50 | % | — | — | % | — | 140,800 | 0.73 | % | 1,000 | 140,800 | 0.73 | % | 1,000 | 91,900 | 0.7 | % | 600 | 95 | % | ||||||||||||||
Cadia, Australia | 100 | % | 28,500 | 0.13 | % | — | 1,009,300 | 0.25 | % | 2,600 | 1,037,800 | 0.25 | % | 2,600 | 163,900 | 0.2 | % | 300 | 87 | % | ||||||||||||||
Boddington, Australia | 100 | % | 97,300 | 0.12 | % | 100 | 168,200 | 0.11 | % | 200 | 265,500 | 0.11 | % | 300 | 3,800 | 0.1 | % | — | 82 | % | ||||||||||||||
NuevaUnión, Chile (4)(6) | 50 | % | 164,300 | 0.19 | % | 300 | 349,900 | 0.34 | % | 1,200 | 514,100 | 0.30 | % | 1,500 | 602,200 | 0.4 | % | 2,300 | 89 | % | ||||||||||||||
Norte Abierto, Chile (4)(7) | 50 | % | 58,000 | 0.23 | % | 100 | 479,900 | 0.20 | % | 900 | 537,900 | 0.20 | % | 1,100 | 373,300 | 0.2 | % | 800 | 86 | % | ||||||||||||||
Conga, Peru (4)(8) | 100 | % | — | — | % | — | 693,800 | 0.26 | % | 1,800 | 693,800 | 0.26 | % | 1,800 | 230,500 | 0.2 | % | 400 | 84 | % | ||||||||||||||
Yanacocha, Peru (9) | 100 | % | 3,700 | 0.29 | % | — | 114,100 | 0.61 | % | 700 | 117,800 | 0.60 | % | 700 | 134,900 | 0.4 | % | 500 | 83 | % | ||||||||||||||
Galore Creek, Canada (4)(10) | 50 | % | 212,800 | 0.44 | % | 900 | 385,600 | 0.47 | % | 1,800 | 598,400 | 0.46 | % | 2,800 | 118,900 | 0.3 | % | 300 | 93 | % | ||||||||||||||
Red Chris, Canada (11) | 70 | % | — | — | % | — | 334,800 | 0.34 | % | 1,100 | 334,800 | 0.34 | % | 1,100 | 62,000 | 0.4 | % | 200 | 81 | % | ||||||||||||||
NGM, United States (12) | 38.5 | % | — | — | % | — | 130,600 | 0.16 | % | 200 | 130,600 | 0.16 | % | 200 | 12,100 | 0.1 | % | — | 69 | % | ||||||||||||||
Total Copper | 564,600 | 0.27 | % | 1,500 | 3,806,800 | 0.30 | % | 11,600 | 4,371,500 | 0.30 | % | 13,100 | 1,793,400 | 0.3 | % | 5,600 | 88 | % | ||||||||||||||||
Article content
Copper Resources at December 31, 2024 (1)(2) | ||||||||||||||||||||||||||||||||||
Measured Resources | Indicated Resources | Measured and Indicated Resources | Inferred Resources | |||||||||||||||||||||||||||||||
Deposits/Districts | Newmont Share | Tonnage (000 tonnes) | Grade (Cu%) | Tonnes (3) (000) | Tonnage (000 tonnes) | Grade (Cu%) | Tonnes (3) (000) | Tonnage (000 tonnes) | Grade (Cu%) | Tonnoes (3) (000) | Tonnage (000 tonnes) | Grade (Cu%) | Tonnes (3) (000) | Metallurgical Recovery (3) | ||||||||||||||||||||
Namosi Open Pit | 73.24 | % | — | — | % | — | 105,500 | 0.61 | % | 600 | 105,500 | 0.61 | % | 600 | 1,346,900 | 0.3 | % | 4,300 | 84 | % | ||||||||||||||
Namosi Underground | 73.24 | % | — | — | % | — | — | — | % | — | — | — | % | — | 209,900 | 0.4 | % | 900 | 92 | % | ||||||||||||||
Total Namosi, Fiji (4) | 73.24 | % | — | — | % | — | 105,500 | 0.61 | % | 600 | 105,500 | 0.61 | % | 600 | 1,556,800 | 0.3 | % | 5,200 | 85 | % | ||||||||||||||
Wafi-Golpu, Papua New Guinea (4) | 50 | % | — | — | % | — | 140,800 | 0.73 | % | 1,000 | 140,800 | 0.73 | % | 1,000 | 91,900 | 0.7 | % | 600 | 95 | % | ||||||||||||||
Cadia, Australia | 100 | % | 30,800 | 0.13 | % | — | 1,245,100 | 0.25 | % | 3,200 | 1,275,900 | 0.25 | % | 3,200 | 560,400 | 0.2 | % | 1,000 | 86 | % | ||||||||||||||
Boddington, Australia | 100 | % | 90,600 | 0.12 | % | 100 | 154,100 | 0.11 | % | 200 | 244,700 | 0.12 | % | 300 | 3,500 | 0.1 | % | — | 83 | % | ||||||||||||||
NuevaUnión, Chile (4)(6) | 50 | % | 164,300 | 0.19 | % | 300 | 349,900 | 0.34 | % | 1,200 | 514,100 | 0.30 | % | 1,500 | 602,200 | 0.4 | % | 2,300 | 89 | % | ||||||||||||||
Norte Abierto, Chile (4)(7) | 50 | % | 57,600 | 0.24 | % | 100 | 551,300 | 0.19 | % | 1,100 | 608,900 | 0.20 | % | 1,200 | 361,800 | 0.2 | % | 700 | 90 | % | ||||||||||||||
Conga, Peru (4) | 100 | % | — | — | % | — | 693,800 | 0.26 | % | 1,800 | 693,800 | 0.26 | % | 1,800 | 230,500 | 0.2 | % | 400 | 84 | % | ||||||||||||||
Yanacocha, Peru | 100 | % | 1,500 | 1.02 | % | — | 99,800 | 0.36 | % | 400 | 101,300 | 0.37 | % | 400 | 39,700 | 0.4 | % | 100 | 81 | % | ||||||||||||||
Galore Creek, Canada (4)(10) | 50 | % | 212,800 | 0.44 | % | 900 | 385,600 | 0.47 | % | 1,800 | 598,400 | 0.46 | % | 2,800 | 118,900 | 0.3 | % | 300 | 93 | % | ||||||||||||||
Red Chris, Canada | 70 | % | — | — | % | — | 335,100 | 0.34 | % | 1,100 | 335,100 | 0.34 | % | 1,100 | 62,100 | 0.4 | % | 200 | 81 | % | ||||||||||||||
NGM, United States (12) | 38.5 | % | — | — | % | — | 113,700 | 0.17 | % | 200 | 113,700 | 0.17 | % | 200 | 11,100 | 0.2 | % | — | 67 | % | ||||||||||||||
Total Copper | 557,600 | 0.28 | % | 1,600 | 4,174,600 | 0.30 | % | 12,600 | 4,732,200 | 0.30 | % | 14,100 | 3,638,800 | 0.3 | % | 11,000 | 87 | % | ||||||||||||||||
Article content
Article content
____________________________ | ||
(1) | Resources are reported exclusive of reserves. Amounts presented may not recalculate in total due to rounding. | |
(2) | At December 31, 2025 and 2024, copper resources at sites in which Newmont is the operator were estimated at a copper price of $4.25 and $4.00 per pound, respectively, unless otherwise noted. Resources provided by other operators may use pricing that differs. Tonnage amounts have been rounded to the nearest 100,000. | |
(3) | Tonnes are estimates of metal contained in ore tonnages and do not include allowances for processing losses. Metallurgical recovery rates represent the estimated amount of metal to be recovered through metallurgical extraction processes. Tonnes may not recalculate as they are rounded to the nearest 100,000. | |
(4) | Included in the non-operating segment Corporate and Other in Note 4 to the Consolidated Financial Statements. | |
(5) | Project is currently undeveloped. Copper resources related to the open pit mine at December 31, 2025 were estimated at a copper price of $3.40 per pound. | |
(6) | Project is currently undeveloped. Copper resources at December 31, 2025 were estimated at a copper price of $3.00 per pound. Copper resources at December 31, 2025 and 2024 were provided by the NuevaUnión joint venture. | |
(7) | Project is currently undeveloped. Copper resources at December 31, 2025 were estimated at a copper price of $4.00 per pound. Copper resources at December 31, 2025 and 2024 were provided by the Norte Abierto joint venture. | |
(8) | Copper resources at December 31, 2025 were estimated at a copper price of $3.50 per pound. | |
(9) | Copper resources related to the Yanacocha Sulfides project at December 31, 2025 were estimated at a copper price of $3.25 per pound. | |
(10) | Project is currently undeveloped. Resource estimates provided by Teck Resources. | |
(11) | Copper resources related to the underground mine at December 31, 2025 were estimated at a copper price of $3.40 per pound. | |
(12) | Copper resources at December 31, 2025 were estimated at a copper price of $4.50 per pound. Copper resources at December 31, 2025 and 2024 were provided by Barrick, the operator of the NGM joint venture. | |
Article content
Silver Reserves (1) | ||||||||||||||||||||||||||||||
December 31, 2025 | December 31, 2024 | |||||||||||||||||||||||||||||
Proven Reserves | Probable Reserves | Proven and Probable Reserves | Proven and Probable Reserves | |||||||||||||||||||||||||||
Deposits/Districts | Newmont Share | Tonnage (2) (000 tonnes) | Grade (g/tonne) | Ounces (3) (000) | Tonnage (2) (000 tonnes) | Grade (g/tonne) | Ounces (3) (000) | Tonnage (2) (000 tonnes) | Grade (g/tonne) | Ounces (3) (000) | Metallurgical Recovery (3) | Tonnage (2) (000 tonnes) | Grade (g/tonne) | Ounces (3) (000) | ||||||||||||||||
Cadia, Australia (4) | 100 | % | — | — | — | 1,007,600 | 0.67 | 21,800 | 1,007,600 | 0.67 | 21,800 | 67 | % | 1,051,800 | 0.67 | 22,800 | ||||||||||||||
Cerro Negro, Argentina | 100 | % | 2,200 | 84.41 | 5,900 | 6,800 | 66.20 | 14,400 | 9,000 | 70.62 | 20,300 | 74 | % | 9,300 | 71.58 | 21,400 | ||||||||||||||
Pueblo Viejo Open Pits | 40 | % | 35,800 | 12.01 | 13,800 | 51,300 | 11.58 | 19,100 | 87,100 | 11.76 | 32,900 | 53 | % | 81,700 | 11.86 | 31,200 | ||||||||||||||
Pueblo Viejo Stockpiles (5) | 40 | % | — | — | — | 36,900 | 13.59 | 16,100 | 36,900 | 13.59 | 16,100 | 53 | % | 38,800 | 14.22 | 17,700 | ||||||||||||||
Total Pueblo Viejo, Dominican Republic (6)(7) | 40 | % | 35,800 | 12.01 | 13,800 | 88,200 | 12.42 | 35,200 | 123,900 | 12.30 | 49,000 | 53 | % | 120,500 | 12.62 | 48,900 | ||||||||||||||
NuevaUnión, Chile (7)(8) | 50 | % | — | — | — | 1,118,000 | 1.31 | 47,200 | 1,118,000 | 1.31 | 47,200 | 66 | % | 1,118,000 | 1.31 | 47,200 | ||||||||||||||
Norte Abierto, Chile (7)(9) | 50 | % | — | — | — | 521,100 | 1.61 | 27,000 | 521,100 | 1.61 | 27,000 | 76 | % | 598,800 | 1.52 | 29,300 | ||||||||||||||
Yanacocha, Peru | 100 | % | — | — | — | 68,300 | 8.82 | 19,400 | 68,300 | 8.82 | 19,400 | 5 | % | 172,300 | 15.05 | 83,400 | ||||||||||||||
Peñasquito Open Pits | 100 | % | 79,500 | 34.50 | 88,200 | 114,800 | 31.09 | 114,700 | 194,300 | 32.49 | 202,900 | 83 | % | 224,700 | 31.09 | 224,600 | ||||||||||||||
Peñasquito Stockpiles (5) | 100 | % | 4,900 | 47.37 | 7,500 | 21,800 | 27.90 | 19,600 | 26,700 | 31.48 | 27,000 | 76 | % | 32,000 | 27.89 | 28,700 | ||||||||||||||
Total Peñasquito, Mexico | 100 | % | 84,400 | 35.25 | 95,700 | 136,600 | 30.58 | 134,300 | 221,000 | 32.37 | 230,000 | 82 | % | 256,600 | 30.70 | 253,300 | ||||||||||||||
Brucejack, Canada | 100 | % | — | — | — | 13,500 | 29.39 | 12,800 | 13,500 | 29.39 | 12,800 | 83 | % | 8,600 | 34.36 | 9,500 | ||||||||||||||
NGM Open Pit | 38.5 | % | — | — | — | 66,200 | 6.54 | 13,900 | 66,200 | 6.54 | 13,900 | 38 | % | 54,600 | 7.78 | 13,700 | ||||||||||||||
NGM Stockpiles (5) | 38.5 | % | 2,700 | 7.89 | 700 | — | — | — | 2,700 | 7.89 | 700 | 38 | % | 3,200 | 7.87 | 800 | ||||||||||||||
Total NGM, United States (10) | 38.5 | % | 2,700 | 7.89 | 700 | 66,200 | 6.54 | 13,900 | 68,900 | 6.59 | 14,600 | 38 | % | 57,900 | 7.78 | 14,500 | ||||||||||||||
Total Silver | 125,000 | 28.88 | 116,000 | 3,026,200 | 3.35 | 326,000 | 3,151,200 | 4.36 | 442,000 | 71 | % | 3,393,800 | 4.86 | 530,200 | ||||||||||||||||
Article content
____________________________ | ||
(1) | At December 31, 2025 and 2024, silver reserves at sites for which Newmont is the operator were estimated at a silver price of $25 and $20 per ounce, respectively, unless otherwise noted. Reserves provided by other operators may use pricing that differs. Amounts presented may not recalculate in total due to rounding. | |
(2) | Tonnages include allowances for losses resulting from mining methods. Tonnages are rounded to nearest 100,000. | |
(3) | Ounces are estimates of metal contained in ore tonnages and do not include allowances for processing losses. Metallurgical recovery rates represent the estimated amount of metal to be recovered through metallurgical extraction processes. Ounces may not recalculate as they are rounded to the nearest 100,000. | |
(4) | The net smelter return value utilized in 2025 reserves not less than $24.62 per tonne. | |
(5) | Stockpiles are comprised primarily of material that has been set aside to allow processing of higher grade material in the mills. Stockpiles increase or decrease depending on current mine plans. Stockpile reserves are reported separately where ounces exceed 100,000 and are greater than 5% of the total site-reported reserves. | |
(6) | The Pueblo Viejo mine, which is 40% owned by Newmont, is accounted for as an equity method investment. Silver reserves at December 31, 2025 were estimated at a silver price of $21 per ounce. Silver reserves at December 31, 2025 and 2024 were provided by Barrick, the operator of Pueblo Viejo. | |
(7) | Included in the non-operating segment Corporate and Other in Note 4 to the Consolidated Financial Statements. | |
(8) | Project is currently undeveloped. Silver reserves at December 31, 2025 were estimated at a silver price of $18 per ounce. Silver reserves at December 31, 2025 and 2024 were provided by the NuevaUnión joint venture. | |
(9) | Project is currently undeveloped. Silver reserves at December 31, 2025 were estimated at a silver price of $25 per ounce. Silver reserves at December 31, 2025 and 2024 were provided by the Norte Abierto joint venture. | |
(10) | Silver cut-off grade varies with gold and copper credits. Silver reserves at December 31, 2025 were estimated at a silver price of $21 per ounce. Silver reserves at December 31, 2025 and 2024 were provided by Barrick, the operator of the NGM joint venture. | |
Article content
Silver Resources (1)(2) – December 31, 2025 | ||||||||||||||||||||||||||||||
Measured Resource | Indicated Resource | Measured and Indicated Resource | Inferred Resource | |||||||||||||||||||||||||||
Deposits/Districts | Newmont Share | Tonnage (000 tonnes) | Grade (g/tonne) | Ounces (3) (000) | Tonnage (000 tonnes) | Grade (g/tonne) | Ounces (3) (000) | Tonnage (000 tonnes) | Grade (g/tonne) | Ounces (3) (000) | Tonnage (000 tonnes) | Grade (g/tonne) | Ounces (3) (000) | Metallurgical Recovery (3) | ||||||||||||||||
Wafi-Golpu, Papua New Guinea (4) | 50 | % | — | — | — | 53,600 | 4.42 | 7,600 | 53,600 | 4.42 | 7,600 | 15,500 | 4.5 | 2,200 | 45 | % | ||||||||||||||
Cadia, Australia | 100 | % | — | — | — | 1,009,300 | 0.62 | 20,200 | 1,009,300 | 0.62 | 20,200 | 163,900 | 0.4 | 2,300 | 68 | % | ||||||||||||||
Pueblo Viejo, Dominican Republic (4)(5) | 40 | % | 7,300 | 6.95 | 1,600 | 33,100 | 7.79 | 8,300 | 40,300 | 7.64 | 9,900 | 6,300 | 8.3 | 1,700 | 53 | % | ||||||||||||||
NuevaUnión, Chile (4)(6) | 50 | % | 164,300 | 0.96 | 5,100 | 349,900 | 1.19 | 13,400 | 514,100 | 1.12 | 18,400 | 602,200 | 1.2 | 22,500 | 66 | % | ||||||||||||||
Norte Abierto, Chile (4)(7) | 50 | % | 77,700 | 1.21 | 3,000 | 525,500 | 1.07 | 18,100 | 603,200 | 1.09 | 21,100 | 381,100 | 1.0 | 12,600 | 79 | % | ||||||||||||||
Peñasquito, Mexico | 100 | % | 52,800 | 28.32 | 48,100 | 172,100 | 25.28 | 139,900 | 224,900 | 26.00 | 188,000 | 9,200 | 24.2 | 7,100 | 80 | % | ||||||||||||||
La Bikina, Mexico (4) | 50 | % | — | — | — | 19,900 | 13.99 | 9,000 | 19,900 | 13.99 | 9,000 | 1,600 | 11.0 | 500 | 25 | % | ||||||||||||||
Cerro Negro Underground | 100 | % | 100 | 72.50 | 200 | 700 | 57.19 | 1,300 | 800 | 59.07 | 1,500 | 7,200 | 28.3 | 6,500 | 75 | % | ||||||||||||||
Cerro Negro Open Pit | 100 | % | 1,200 | 6.76 | 300 | 1,200 | 6.62 | 300 | 2,400 | 6.70 | 500 | 300 | 6.7 | 100 | 71 | % | ||||||||||||||
Total Cerro Negro, Argentina | 100 | % | 1,300 | 11.74 | 500 | 1,900 | 25.50 | 1,600 | 3,200 | 19.88 | 2,000 | 7,500 | 27.4 | 6,600 | 75 | % | ||||||||||||||
Conga, Peru (4)(8) | 100 | % | — | — | — | 693,800 | 2.06 | 45,900 | 693,800 | 2.06 | 45,900 | 175,000 | 1.1 | 6,300 | 70 | % | ||||||||||||||
Yanacocha Open Pit | 100 | % | 15,600 | 7.91 | 3,900 | 96,300 | 19.80 | 61,300 | 111,900 | 18.14 | 65,200 | 89,500 | 14.3 | 41,300 | 55 | % | ||||||||||||||
Yanacocha Leach Pad (9) | 100 | % | — | — | — | 57,100 | 2.03 | 3,700 | 57,100 | 2.03 | 3,700 | 11,600 | 4.4 | 1,600 | 3 | % | ||||||||||||||
Yanacocha Underground | 100 | % | 3,700 | 0.21 | — | 14,900 | 15.49 | 7,400 | 18,600 | 12.45 | 7,400 | 3,600 | 38.4 | 4,400 | 83 | % | ||||||||||||||
Total Yanacocha, Peru (10) | 100 | % | 19,300 | 6.41 | 4,000 | 168,200 | 13.39 | 72,400 | 187,500 | 12.67 | 76,400 | 104,700 | 14.1 | 47,300 | 55 | % | ||||||||||||||
Galore Creek, Canada (4)(11) | 50 | % | 212,800 | 4.08 | 27,900 | 385,600 | 4.77 | 59,100 | 598,400 | 4.52 | 87,000 | 118,900 | 2.6 | 9,900 | 73 | % | ||||||||||||||
Brucejack, Canada | 100 | % | — | — | — | 4,300 | 15.90 | 2,200 | 4,300 | 15.90 | 2,200 | 14,500 | 11.7 | 5,500 | 82 | % | ||||||||||||||
NGM, United States (12) | 38.5 | % | — | — | — | 121,000 | 5.22 | 20,300 | 121,000 | 5.22 | 20,300 | 10,100 | 5.4 | 1,800 | 38 | % | ||||||||||||||
Total Silver | 535,500 | 5.24 | 90,200 | 3,538,100 | 3.67 | 418,000 | 4,073,600 | 3.88 | 508,200 | 1,610,400 | 2.4 | 126,400 | 68 | % | ||||||||||||||||
Article content
Article content
Silver Resources (1)(2) – December 31, 2024 | ||||||||||||||||||||||||||||||
Measured Resource | Indicated Resource | Measured and Indicated Resource | Inferred Resource | |||||||||||||||||||||||||||
Deposits/Districts | Newmont Share | Tonnage (000 tonnes) | Grade (g/tonne) | Ounces (3) (000) | Tonnage (000 tonnes) | Grade (g/tonne) | Ounces (3) (000) | Tonnage (000 tonnes) | Grade (g/tonne) | Ounces (3) (000) | Tonnage (000 tonnes) | Grade (g/tonne) | Ounces (3) (000) | Metallurgical Recovery (3) | ||||||||||||||||
Wafi-Golpu, Papua New Guinea (4) | 50 | % | — | — | — | 53,600 | 4.42 | 7,600 | 53,600 | 4.42 | 7,600 | 15,500 | 4.5 | 2,200 | 45 | % | ||||||||||||||
Cadia, Australia | 100 | % | — | — | — | 1,245,100 | 0.65 | 26,100 | 1,245,100 | 0.65 | 26,100 | 549,400 | 0.4 | 7,900 | 67 | % | ||||||||||||||
Pueblo Viejo, Dominican Republic (4)(5) | 40 | % | 8,200 | 7.69 | 2,000 | 38,200 | 7.82 | 9,600 | 46,400 | 7.80 | 11,600 | 5,000 | 6.8 | 1,100 | 71 | % | ||||||||||||||
NuevaUnión, Chile (4)(6) | 50 | % | 164,300 | 0.96 | 5,100 | 349,900 | 1.19 | 13,400 | 514,100 | 1.12 | 18,400 | 602,200 | 1.2 | 22,500 | 66 | % | ||||||||||||||
Norte Abierto, Chile (4)(7) | 50 | % | 77,200 | 1.20 | 3,000 | 596,900 | 1.07 | 20,600 | 674,200 | 1.09 | 23,500 | 369,600 | 1.0 | 11,300 | 78 | % | ||||||||||||||
Peñasquito, Mexico | 100 | % | 48,200 | 27.22 | 42,200 | 163,100 | 24.84 | 130,300 | 211,300 | 25.39 | 172,400 | 21,100 | 25.4 | 17,200 | 80 | % | ||||||||||||||
La Bikina, Mexico (4) | 50 | % | — | — | — | 19,900 | 13.99 | 9,000 | 19,900 | 13.99 | 9,000 | 1,600 | 11.0 | 500 | 25 | % | ||||||||||||||
Cerro Negro Underground | 100 | % | 100 | 70.12 | 300 | 700 | 61.42 | 1,400 | 900 | 62.67 | 1,700 | 7,300 | 26.5 | 6,200 | 76 | % | ||||||||||||||
Cerro Negro Open Pit | 100 | % | 1,200 | 6.76 | 300 | 1,200 | 6.62 | 300 | 2,400 | 6.70 | 500 | 300 | 6.7 | 100 | 71 | % | ||||||||||||||
Total Cerro Negro, Argentina | 100 | % | 1,300 | 12.61 | 500 | 1,900 | 27.54 | 1,700 | 3,200 | 21.43 | 2,200 | 7,600 | 25.7 | 6,300 | 75 | % | ||||||||||||||
Conga, Peru (4) | 100 | % | — | — | — | 693,800 | 2.06 | 45,900 | 693,800 | 2.06 | 45,900 | 175,000 | 1.1 | 6,300 | 70 | % | ||||||||||||||
Yanacocha Open Pit | 100 | % | 16,300 | 6.71 | 3,500 | 103,900 | 10.16 | 33,900 | 120,200 | 9.69 | 37,400 | 26,300 | 13.4 | 11,400 | 43 | % | ||||||||||||||
Yanacocha Leach Pad | 100 | % | — | — | — | — | — | — | — | — | — | 62,700 | 2.2 | 4,500 | 4 | % | ||||||||||||||
Yanacocha Underground | 100 | % | 500 | 0.37 | — | 6,200 | 37.02 | 7,300 | 6,700 | 34.23 | 7,400 | 3,400 | 40.4 | 4,400 | 83 | % | ||||||||||||||
Total Yanacocha, Peru | 100 | % | 16,800 | 6.52 | 3,500 | 110,100 | 11.66 | 41,300 | 126,900 | 10.98 | 44,800 | 92,400 | 6.8 | 20,300 | 47 | % | ||||||||||||||
Galore Creek, Canada (4)(11) | 50 | % | 212,800 | 4.08 | 27,900 | 385,600 | 4.77 | 59,100 | 598,400 | 4.52 | 87,000 | 118,900 | 2.6 | 9,900 | 73 | % | ||||||||||||||
Brucejack, Canada | 100 | % | — | — | — | 4,300 | 19.68 | 2,700 | 4,300 | 19.68 | 2,700 | 16,600 | 11.6 | 6,200 | 82 | % | ||||||||||||||
NGM, United States (12) | 38.5 | % | — | — | — | 98,300 | 5.64 | 17,800 | 98,300 | 5.64 | 17,800 | 10,300 | 4.2 | 1,400 | 38 | % | ||||||||||||||
Total Silver | 528,900 | 4.96 | 84,300 | 3,760,700 | 3.18 | 385,000 | 4,289,600 | 3.40 | 469,200 | 1,985,100 | 1.8 | 113,200 | 69 | % | ||||||||||||||||
Article content
___________________________ | ||
(1) | Resources are reported exclusive of reserves. Amounts presented may not recalculate in total due to rounding. | |
(2) | At December 31, 2025 and 2024, silver resources at sites in which Newmont is the operator were estimated at a silver price of $28 and $23 per ounce, respectively, unless otherwise noted. Resources provided by other operators may use pricing that differs. Tonnage amounts have been rounded to the nearest 100,000. | |
(3) | Ounces are estimates of metal contained in ore tonnages and do not include allowances for processing losses. Metallurgical recovery rates represent the estimated amount of metal to be recovered through metallurgical extraction processes. Ounces may not recalculate as they are rounded to the nearest 100,000. | |
(4) | Included in the non-operating segment Corporate and Other in Note 4 to the Consolidated Financial Statements. | |
(5) | Silver resources at December 31, 2025 were estimated at a silver price of $25 per ounce. Silver resources at December 31, 2025 and 2024 were provided by Barrick, the operator of the Pueblo Viejo. | |
(6) | Project is currently undeveloped. Silver resources at December 31, 2025 were estimated at a silver price of $18 per ounce. Silver resources at December 31, 2025 and 2024 were provided by the NuevaUnión joint venture. | |
(7) | Project is currently undeveloped. Silver resources at December 31, 2025 were estimated at a silver price of $23 per ounce. Silver resources at December 31, 2025 and 2024 were provided by the Norte Abierto joint venture. | |
(8) | Silver resources at December 31, 2025 were estimated at a silver price of $26 per ounce. | |
(9) | Leach pad material is the material on leach pads at the end of the year from which silver remains to be recovered. In-process resources are reported separately where ounces exceed 100,000 and are greater than 5% of the total site-reported resources. | |
(10) | Silver resources related to the Yanacocha Sulfides project at December 31, 2025 were estimated at a silver price of $23 per ounce. | |
(11) | Project is currently undeveloped. Resource estimates provided by Teck Resources. | |
(12) | Silver resources at December 31, 2025 were estimated at a silver price of $25 per ounce. Silver resources at December 31, 2025 and 2024 were provided by Barrick, the operator of the NGM joint venture. | |
Article content
Article content
Lead Reserves (1) | ||||||||||||||||||||||||||||||||||
December 31, 2025 | December 31, 2024 | |||||||||||||||||||||||||||||||||
Proven Reserves | Probable Reserves | Proven and Probable Reserves | Proven and Probable Reserves | |||||||||||||||||||||||||||||||
Deposits/Districts | Newmont Share | Tonnage (2) (000 tonnes) | Grade (Pb %) | Tonnes (3) (000) | Tonnage (2) (000 tonnes) | Grade (Pb %) | Tonnes (3) (000) | Tonnage (2) (000 tonnes) | Grade (Pb %) | Tonnes (3) (000) | Metallurgical Recovery (3) | Tonnage (2) (000 tonnes) | Grade (Pb %) | Tonnes (3) (000) | ||||||||||||||||||||
Peñasquito, Mexico | 100 | % | 84,400 | 0.34 | % | 300 | 136,600 | 0.28 | % | 400 | 221,000 | 0.30 | % | 700 | 75 | % | 256,600 | 0.31 | % | 800 | ||||||||||||||
Total Lead | 84,400 | 0.34 | % | 300 | 136,600 | 0.28 | % | 400 | 221,000 | 0.30 | % | 700 | 75 | % | 256,600 | 0.31 | % | 800 | ||||||||||||||||
Article content
____________________________ | ||
(1) | At December 31, 2025 and 2024, lead reserves were estimated at a lead price of $0.90 per pound. Amounts presented may not recalculate in total due to rounding. | |
(2) | Tonnages include allowances for losses resulting from mining methods. Tonnages are rounded to nearest 100,000. | |
(3) | Tonnes are estimates of metal contained in ore tonnages and do not include allowances for processing losses. Metallurgical recovery rates represent the estimated amount of metal to be recovered through metallurgical extraction processes. Tonnes may not recalculate as they are rounded to the nearest 100,000. | |
Article content
Lead Resources (1)(2) – December 31, 2025 | ||||||||||||||||||||||||||||||||||
Measured Resource | Indicated Resource | Measured and Indicated Resource | Inferred Resource | |||||||||||||||||||||||||||||||
Deposits/Districts | Newmont Share | Tonnage (000 tonnes) | Grade (Pb %) | Tonnes (3) (000) | Tonnage (000 tonnes) | Grade (Pb %) | Tonnes (3) (000) | Tonnage (000 tonnes) | Grade (Pb %) | Tonnes (3) (000) | Tonnage (000 tonnes) | Grade (Pb %) | Tonnes (3) (000) | Metallurgical Recovery (3) | ||||||||||||||||||||
Peñasquito, Mexico | 100 | % | 52,800 | 0.26 | % | 100 | 172,100 | 0.24 | % | 400 | 224,900 | 0.24 | % | 500 | 9,200 | 0.2 | % | — | 73 | % | ||||||||||||||
Total Lead | 52,800 | 0.26 | % | 100 | 172,100 | 0.24 | % | 400 | 224,900 | 0.24 | % | 500 | 9,200 | 0.2 | % | — | 73 | % | ||||||||||||||||
Article content
Lead Resources (1)(2) – December 31, 2024 | ||||||||||||||||||||||||||||||||||
Measured Resource | Indicated Resource | Measured and Indicated Resource | Inferred Resource | |||||||||||||||||||||||||||||||
Deposits/Districts | Newmont Share | Tonnage (000 tonnes) | Grade (Pb %) | Tonnes (3) (000) | Tonnage (000 tonnes) | Grade (Pb %) | Tonnes (3) (000) | Tonnage (000 tonnes) | Grade (Pb %) | Tonnes (3) (000) | Tonnage (000 tonnes) | Grade (Pb %) | Tonnes (3) (000) | Metallurgical Recovery (3) | ||||||||||||||||||||
Peñasquito, Mexico | 100 | % | 48,200 | 0.25 | % | 100 | 163,100 | 0.23 | % | 400 | 211,300 | 0.23 | % | 500 | 21,100 | 0.2 | % | — | 73 | % | ||||||||||||||
Total Lead | 48,200 | 0.25 | % | 100 | 163,100 | 0.23 | % | 400 | 211,300 | 0.23 | % | 500 | 21,100 | 0.2 | % | — | 73 | % | ||||||||||||||||
Article content
____________________________ | ||
(1) | Resources are reported exclusive of reserves. | |
(2) | At December 31, 2025 and 2024, lead resources were estimated at a lead price of $1.00 per pound. Tonnage amounts have been rounded to the nearest 100,000. | |
(3) | Tonnes are estimates of metal contained in ore tonnages and do not include allowances for processing losses. Metallurgical recovery rates represent the estimated amount of metal to be recovered through metallurgical extraction processes. Tonnes may not recalculate as they are rounded to the nearest 100,000. | |
Article content
Zinc Reserves (1) | ||||||||||||||||||||||||||||
December 31, 2025 | December 31, 2024 | |||||||||||||||||||||||||||
Proven Reserves | Probable Reserves | Proven and Probable Reserves | Proven and Probable Reserves | |||||||||||||||||||||||||
Deposits/Districts | Newmont Share | Tonnage (2) (000 tonnes) | Grade (Zn %) | Tonnes (3) (000) | Tonnage (2) (000 tonnes) | Grade (Zn %) | Tonnes (3) (000) | Tonnage (2) (000 tonnes) | Grade (Zn %) | Tonnes (3) (000) | Metallurgical Recovery (3) | Tonnage (2) (000 tonnes) | Grade (Zn %) | Tonnes (3) (000) | ||||||||||||||
Peñasquito Open Pits, Mexico | 100% | 79,500 | 0.77% | 600 | 114,800 | 0.60% | 700 | 194,300 | 0.67% | 1,300 | 83% | 224,700 | 0.69% | 1,500 | ||||||||||||||
Peñasquito Stockpiles, Mexico (4) | 100% | 4,900 | 1.25% | 100 | 21,800 | 0.54% | 100 | 26,700 | 0.67% | 200 | 78% | 32,000 | 0.58% | 200 | ||||||||||||||
Total Zinc | 84,400 | 0.80% | 700 | 136,600 | 0.59% | 800 | 221,000 | 0.67% | 1,500 | 82% | 256,600 | 0.68% | 1,700 | |||||||||||||||
Article content
____________________________ | ||
(1) | At December 31, 2025 and 2024, zinc reserves were estimated at a zinc price of $1.20 per pound. Amounts presented may not recalculate in total due to rounding. | |
(2) | Tonnages include allowances for losses resulting from mining methods. Tonnages are rounded to nearest 100,000. | |
(3) | Tonnes are estimates of metal contained in ore tonnages and do not include allowances for processing losses. Metallurgical recovery rates represent the estimated amount of metal to be recovered through metallurgical extraction processes. Tonnes may not recalculate as they are rounded to the nearest 100,000. | |
(4) | Stockpiles are comprised primarily of material that has been set aside to allow processing of higher grade material in the mills. Stockpiles increase or decrease depending on current mine plans. Stockpile reserves are reported separately where pounds exceed 100 million and are greater than 5% of the total site-reported reserves. | |
Article content
Zinc Resources (1)(2) – December 31, 2025 | ||||||||||||||||||||||||||||||||||
Measured Resource | Indicated Resource | Measured and Indicated Resource | Inferred Resource | |||||||||||||||||||||||||||||||
Deposits/Districts | Newmont Share | Tonnage (000 tonnes) | Grade (Zn %) | Tonnes (3) (000) | Tonnage (000 tonnes) | Grade (Zn %) | Tonnes (3) (000) | Tonnage (000 tonnes) | Grade (Zn %) | Tonnes (3) (000) | Tonnage (000 tonnes) | Grade (Zn %) | Tonnes (3) (000) | Metallurgical Recovery (3) | ||||||||||||||||||||
Peñasquito, Mexico | 100 | % | 52,800 | 0.72 | % | 400 | 172,100 | 0.57 | % | 1,000 | 224,900 | 0.60 | % | 1,400 | 9,200 | 0.5 | % | — | 82 | % | ||||||||||||||
Total Zinc | 52,800 | 0.72 | % | 400 | 172,100 | 0.57 | % | 1,000 | 224,900 | 0.60 | % | 1,400 | 9,200 | 0.5 | % | — | 82 | % | ||||||||||||||||
Article content
Article content
This Post contains more content. For the full press release please view source version on Businesswire.com:
https://www.businesswire.com/news/home/20260219894602/en/
Article content
Article content

Article content
Contacts
Article content
Investor Contact – Global
Article content
Article content
Neil Backhouse
Article content
Article content
Article content
Investor Contact – Asia Pacific
Article content
Article content
Clare Kasperzak
Article content
Article content
Article content
Media Contact – Global
Article content
Article content
Shannon Brushe
Article content
Article content
Article content
Media Contact – Asia Pacific
Article content
Article content
Rosalie Cobai
Article content
Article content
Article content
Article content
 English (US)